Stellar (XLM) Forms Signal That Last Led To 95% Price Rally
Alex Smith
1 month ago
A cryptocurrency analyst has pointed out how Stellar has just seen a TD Sequential buy signal. Here’s what happened the last time the pattern surfaced.
Stellar Shot Up The Last Time A TD Buy Signal Appeared At Current Prices
In a new post on X, analyst Ali Martinez has talked about a Tom Demark (TD) Sequential signal that has appeared in the 1-week price of Stellar. The TD Sequential is a technical analysis (TA) indicator that’s used for pinpointing locations of probable reversal in an asset’s price.
The indicator involves two phases. In both of them, it works by counting up candles of the same polarity (that is, whether red or green) in the asset’s chart. These candles don’t have to be consecutive.
During the first phase, called the setup, this count runs until nine candles of a color are in. Once the indicator finishes the setup, the price can be assumed to have reached a potential point of turnaround. Naturally, this signal is a bullish one if the candles leading up to the setup’s completion were red. On the other hand, it’s bearish in the case of nine green candles.
As soon as the setup is over, the second phase, known as the countdown, kicks off. In this phase, the candle count runs until 13. After the countdown is over, the asset could be considered to have arrived at another reversal.
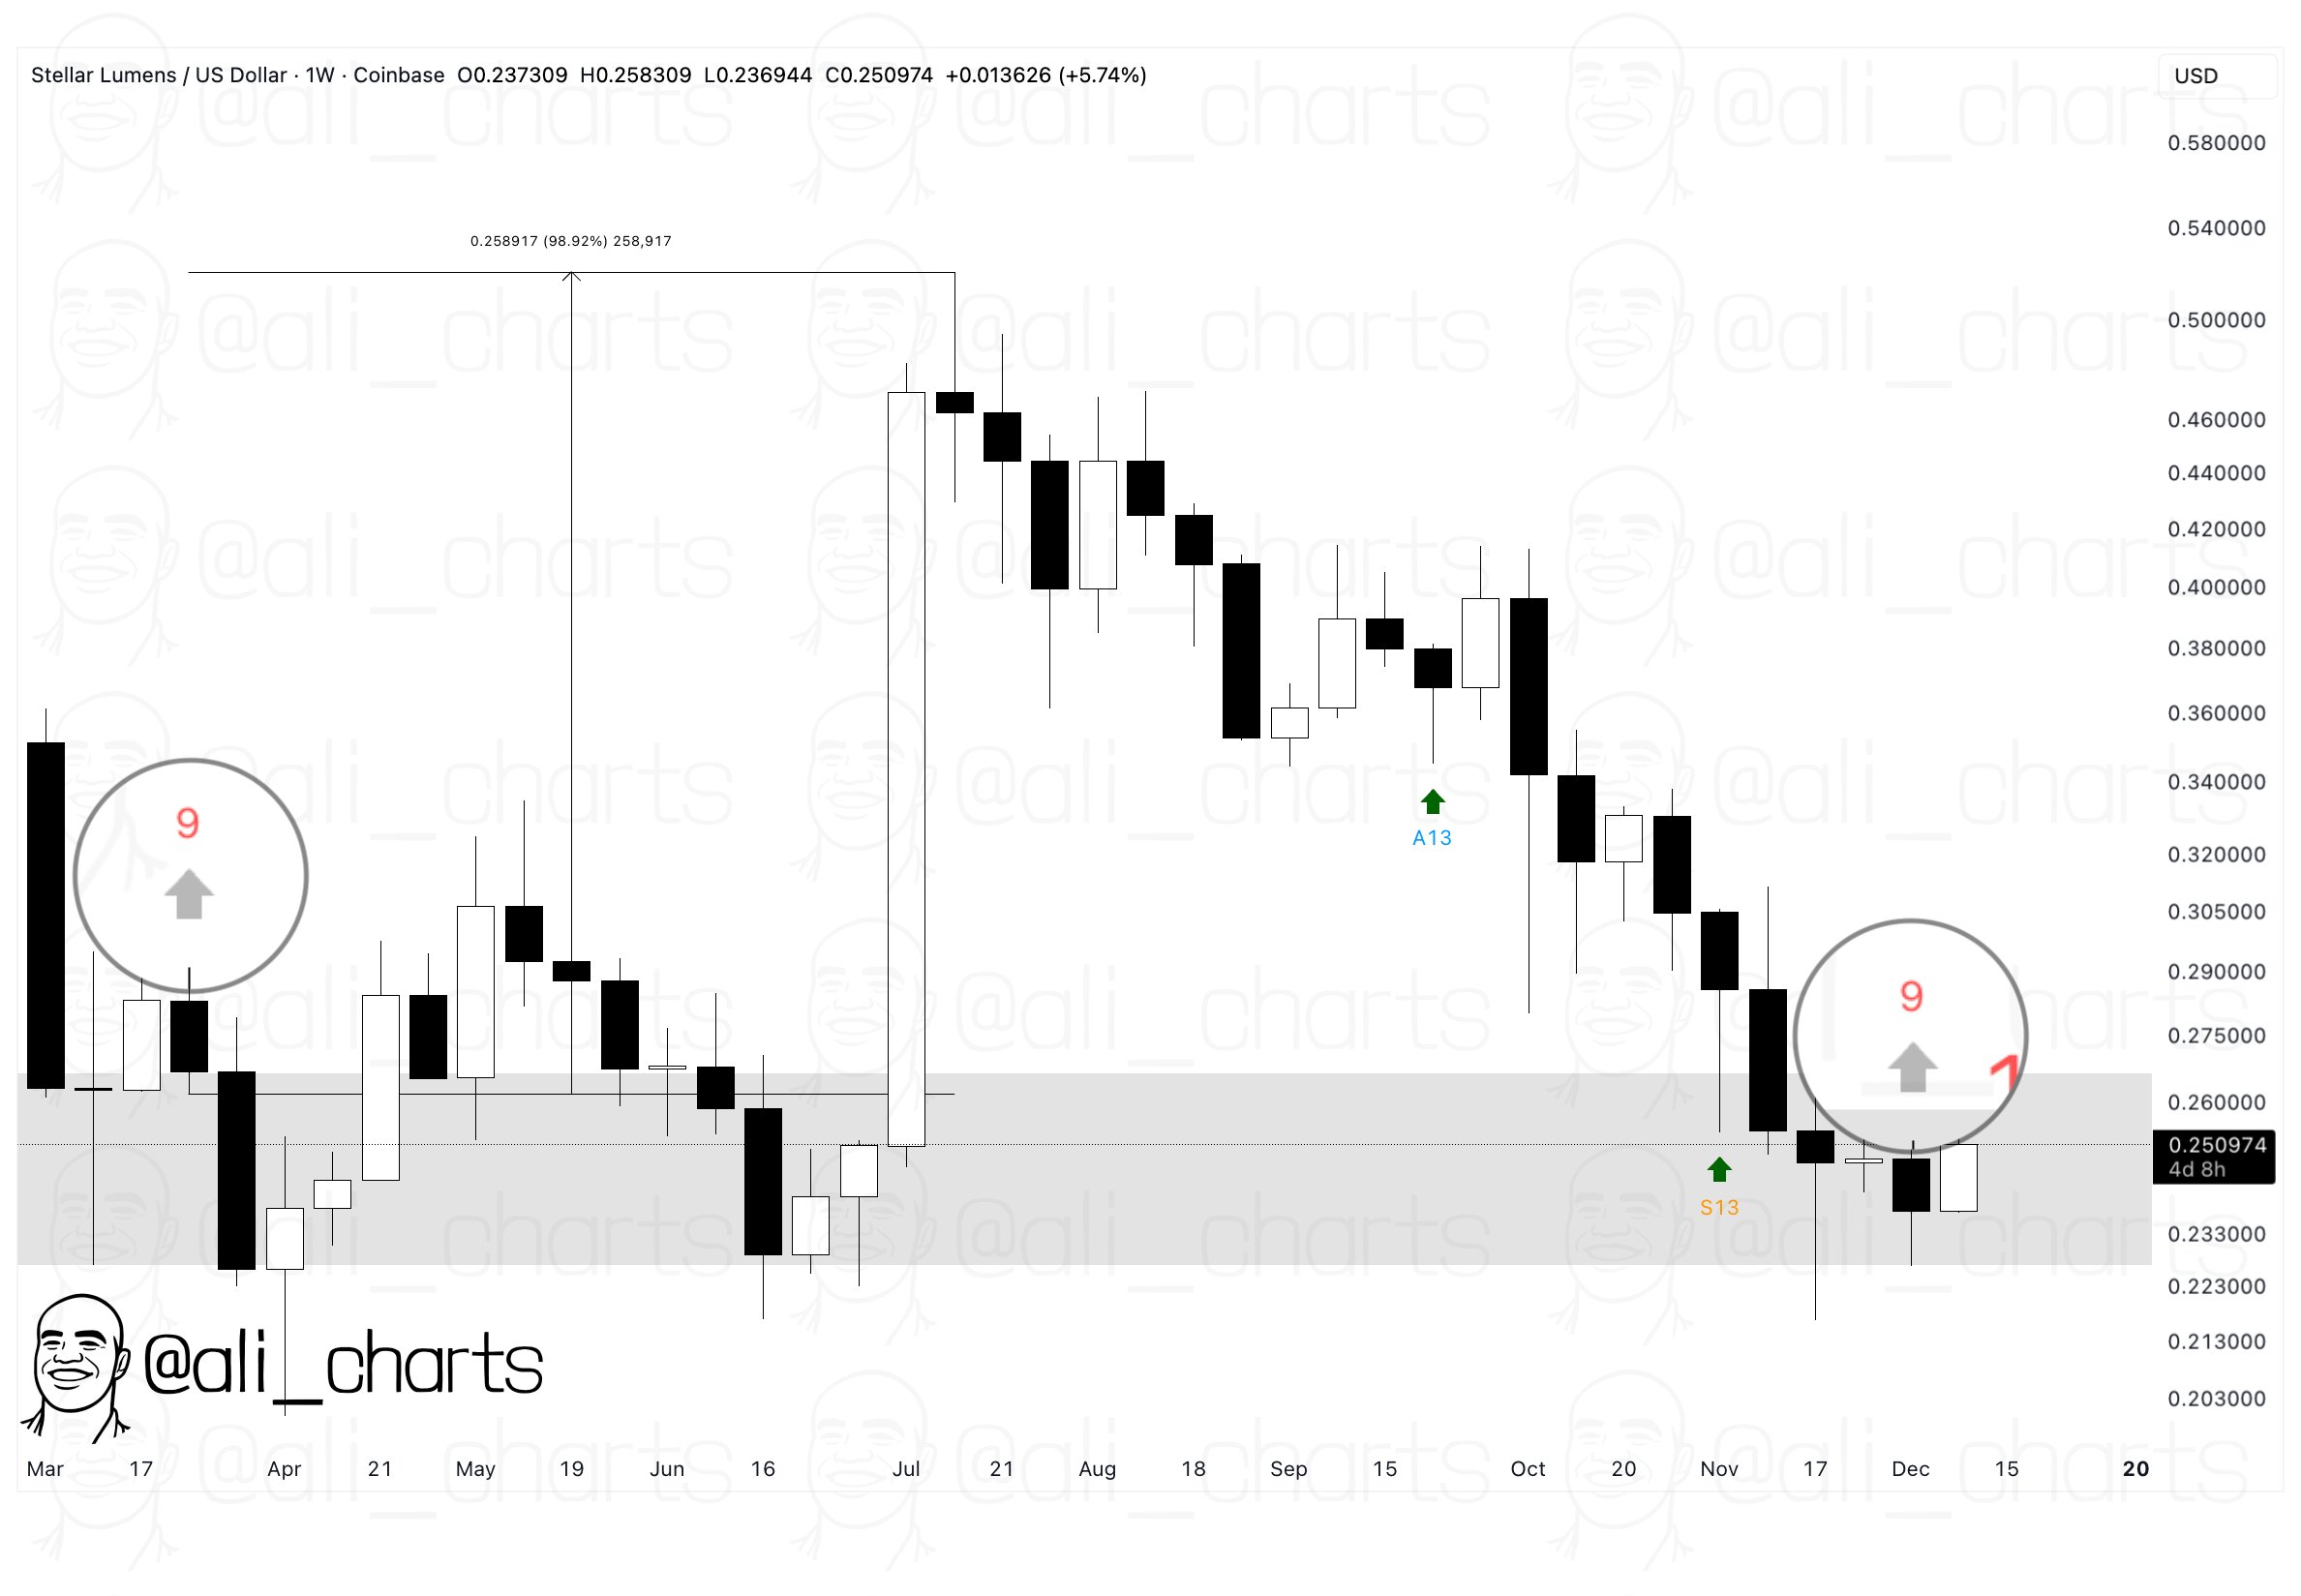
The TD Sequential has just completed the former of the two phases for Stellar. Below is the chart shared by the analyst that shows this pattern forming in the weekly XLM price.
As displayed in the graph, Stellar has formed the latest TD Sequential setup with nine red candles, implying that the downtrend may be reaching a state of exhaustion and a bullish reversal could be due for the asset.
Interestingly, this isn’t the first time that XLM has shown a TD Sequential buy signal at the current price levels during the last few months. From the chart, it’s visible that this pattern also emerged when the cryptocurrency was trading at similar levels in March. That setup in the indicator eventually led to a price surge of 95% for Stellar. Given this trend, it’s possible that the latest signal could also prove to be bullish for XLM.
Something to note, however, is that the TD Sequential setup didn’t immediately lead into the big price rally back then; it took a while of consolidation before the breakout appeared.
It now remains to be seen whether the indicator will hold for Stellar this time, and if so, how long a rally will take to appear.
XLM Price
At the time of writing, Stellar is trading around $0.243, down more than 4% over the last week.
Related Articles

XRP ‘Looks Different’ This Cycle, Targets No. 2 Spot: Crypto Analyst
Crypto Insight UK director Will Taylor argued in a new video that XRP is “tradin...
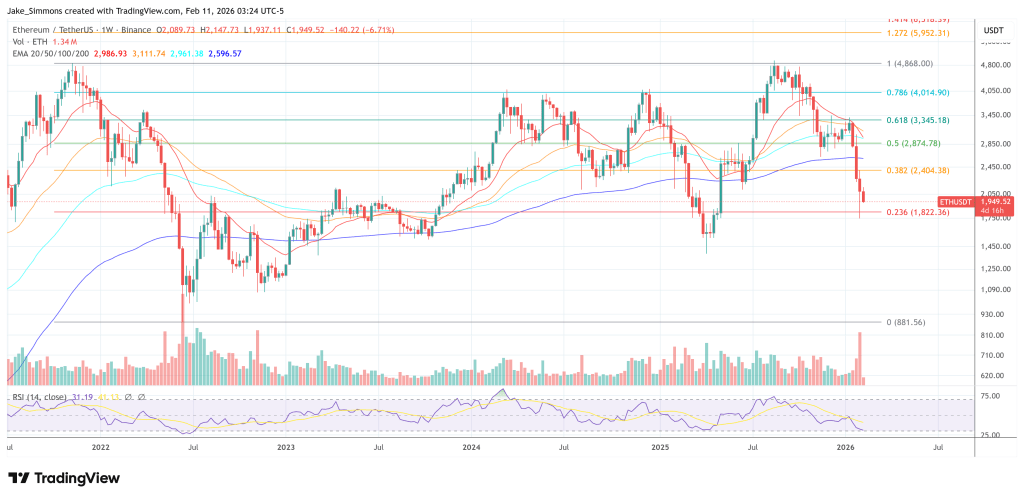
Ethereum ETF ‘Diamond Hands’ Face Their Harshest Test At $2,000
Ethereum ETF investors are sitting on a far uglier entry point than their bitcoi...
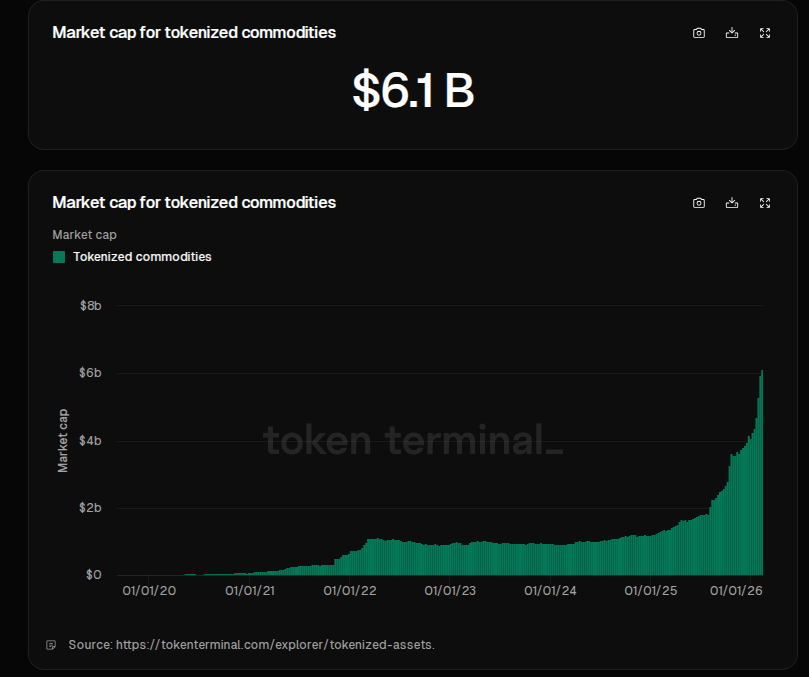
Blockchain Meets Gold: Tokenized Commodities Hit $6 Billion
Markets have put more gold on blockchains, And the shift has been rapid. Reports...

XRP Positioned For Major Structure Shift As Price Tests Critical Level
After recovering from last week’s lows, XRP has been moving sideways, hovering b...