Technical View: Nifty, Bank Nifty & Sensex Trade Setup and Key levels to watch for 9th December
Alex Smith
2 months ago

Domestic equities began the week on a weak note, with both the Nifty 50 and the Sensex opening lower and extending losses through the session. Despite trading above several key longer-term moving averages, the benchmarks slipped below their short-term trend indicators, reflecting a shift in near-term sentiment. Profit-booking pressure and subdued momentum contributed to a broadly bearish undertone across major indices, while momentum oscillators hovered in neutral territory, indicating cooling strength rather than excessive weakness.
Sectoral performance was uniformly negative, with real estate, public-sector banks, and media stocks leading the decline. Broader indices mirrored this weakness as investors trimmed exposure across most pockets of the market. Global cues were mixed, with major Asian markets showing divergent trends, some posting mild gains while others retreated, offering little directional support to domestic sentiment.
In this overview, we will analyse the key technical levels and trend directions for Nifty and BSE Sensex to monitor in the upcoming trading sessions. All the charts mentioned below are based on the 15-minute timeframe.
NIFTY 50 Chart & Price Action Analysis
To view other technical reports, click here
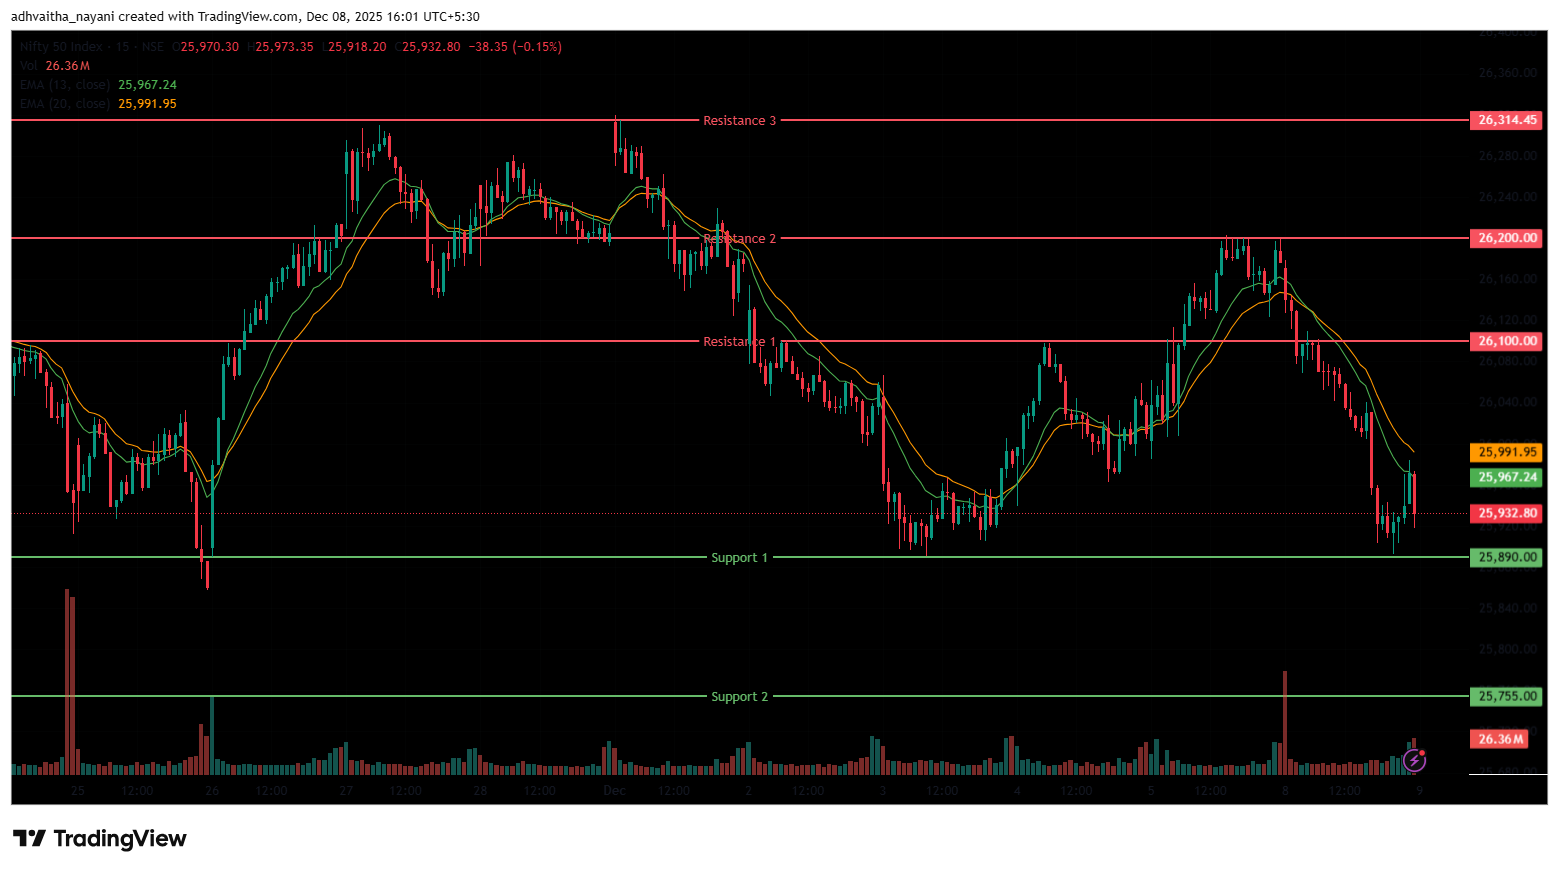
The Nifty 50 Index opened on a negative note at 26,159.80 on Monday, down by 26.65 points from Friday’s closing of 26,186.45. The index started the session on a bearish note, opened below the 26,200 level and was dragged down further due to broad-based profit booking. It was trading in a declining trend during the morning session and remained within the range of 26,020 and 26,150.
In the afternoon session, it continued to fall further, declining below the 26,000 mark, and hit its day’s low at 25,892.25. The Index was trading between the range of 25,900 and 26,000. Finally, it had closed on a negative note at 25,960.55, down by 225.9 points, or 0.86%. In the short term, the Index closed below the 13- and 20-day EMA, indicating a short-term bearish outlook in the daily time frame.
The Nifty 50’s nearest resistance levels are at 26,100 (R1) and 26,200 (R2), and a higher resistance at 26,314.45 (R3). On the other hand, the closest support is now at 25,890 (S1), and the next one at 25,755 (S2), where the index took support previously.
Trade Setup:
Nifty 50Resistance 326,314.45Resistance 226,200.00Resistance 126,100.00Closing Price25,960.55Support 125,890.00Support 225,755.00NIFTY 50 Momentum Indicators Analysis
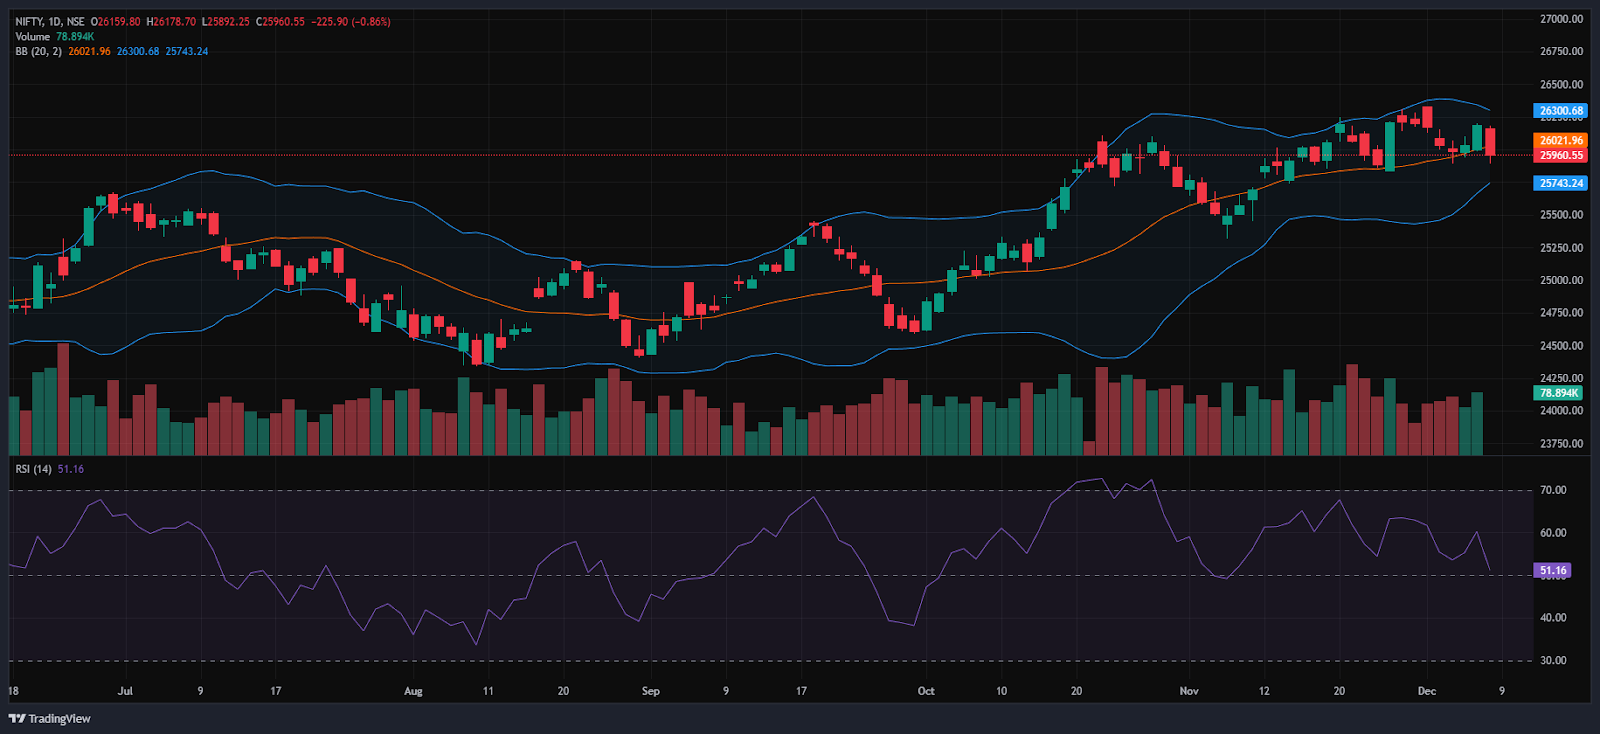
RSI (Daily): The Nifty 50’s RSI stood at 51.16, which is below the overbought zone of 70, indicating room to grow higher.
Bollinger Bands (Daily): The index is trading in the upper band of the Bollinger Band range but near the middle band. Its position in the upper range suggests a bullish sentiment in the short term. However, on Monday’s session, the Index formed a Big bearish candlestick pattern, with a small wick on the upside and a little longer wick on the downside, indicating bearishness. The index stayed below the 26,000 level on Monday’s session and was hovering near the 25,950 level. A sustained move above the middle band signals a bullish sentiment, while a drop back toward the lower band may reinforce bearish sentiment.
Volume Analysis: Monday’s trading session had an average volume of 320.73 Mn.
Derivatives Data: Options open interest (OI) data suggest a strong support zone around 25,800 and 25,900, where put option writing is high, indicating traders expect the index to hold these levels. On the upside, significant call option open interest at 26,000 and 26,100 signals resistance, as sellers are likely to defend these strike prices. The Put/Call Ratio (PCR) stands at 0.48, which is below 1 and indicates a neutral to bullish sentiment with more call activity than put. The presence of a short Buildup indicates strong bearish sentiment, meaning traders are aggressively taking new short positions (betting on a price drop), which is generally considered a bearish signal. This combination implies the market may trade in a range, with strong support near 25,800-25,900 and resistance near 26,000-26,100, until a decisive breakout occurs.
Bank Nifty Chart & Price Action Analysis
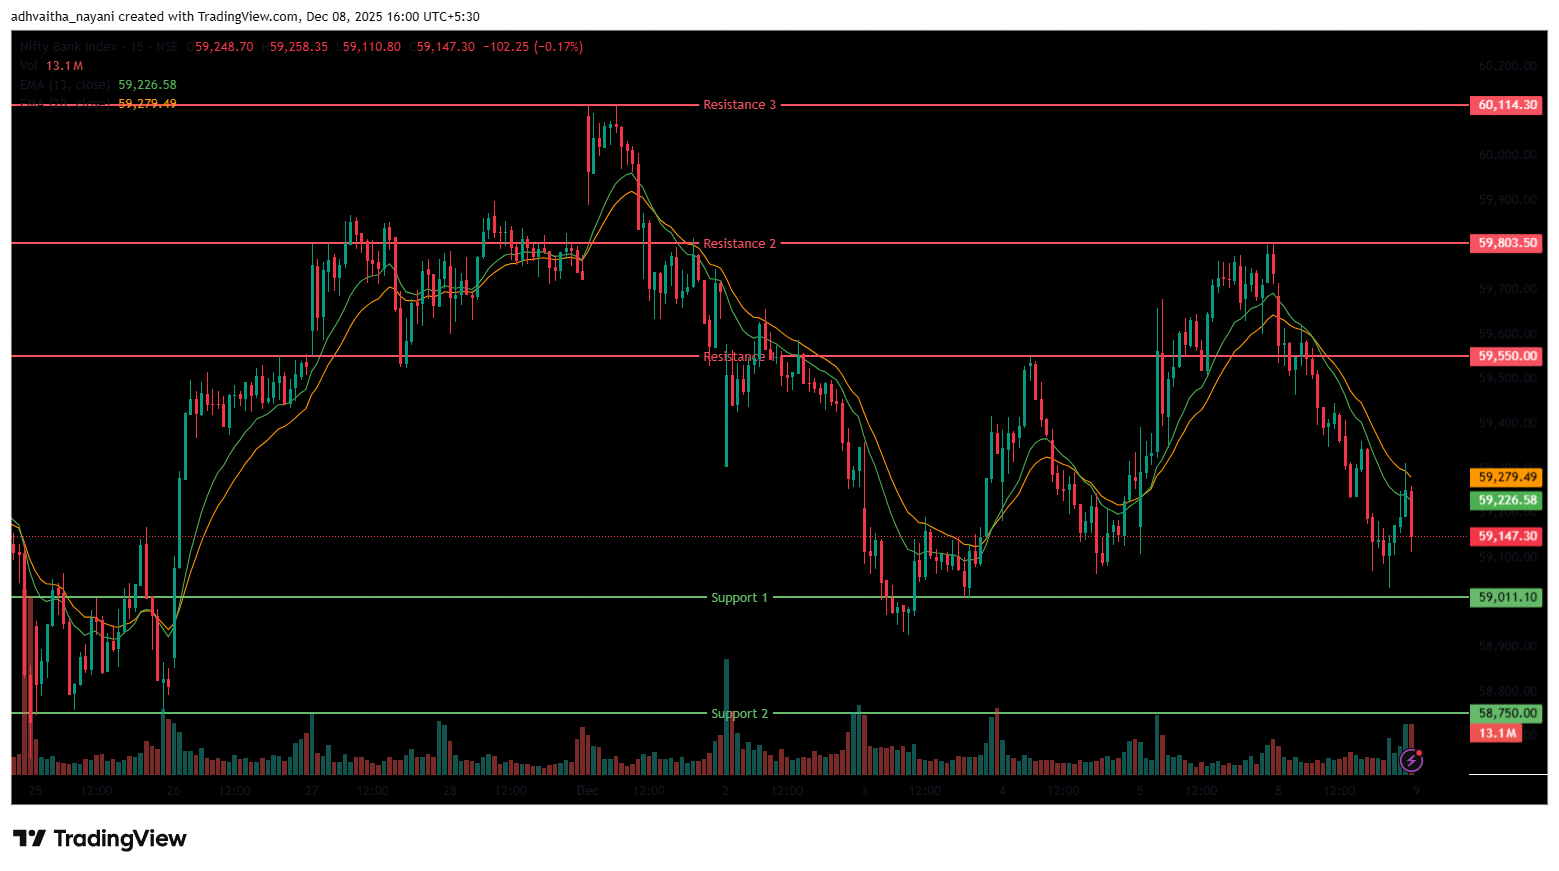
The Bank Nifty Index opened on a negative note at 59,672.05, below the 59,700 level, on Monday, down by 105.15 points from Friday’s closing of 59,777.20. The index opened on a negative note and fell to the 59,200 level. During the morning session, the index was trading in a downtrend, in the range of 59,200 and 59,700 levels. In the afternoon session, the index continued the negative momentum, and it was trading in the range of 59,000 and 59,360, ending the day below the 59,300 mark.
The index hit its day’s low at 59,030.60. Finally, it had closed on a bearish note at 59,238.55, down by -538.65 points or 0.90%. The Relative Strength Index (RSI) stood at 56.95, below the overbought zone of 70 in the daily time frame. In the short term, the Index was above the 20-day EMA but below the 13-day EMA on the daily time frame and formed a strong bearish candle on Monday, with smaller wicks, indicating a negative outlook in the near term.
The nearest resistance is at 59,550 (R1) and 59,803.50 (R2). The higher resistance is at 60,114.30 (R3), which is the all-time high for the index. On the other hand, the closest support is now at 59,011.70 (S1), and the next support is at 58,750 (S2), where the index has taken support at this level previously.
Trade Setup:
Bank NiftyResistance 360,114.30Resistance 259,803.50Resistance 159,550.00Closing Price59,238.55Support 159,011.70Support 258,750.00BSE Sensex Chart & Price Action Analysis
To view other technical reports, click here
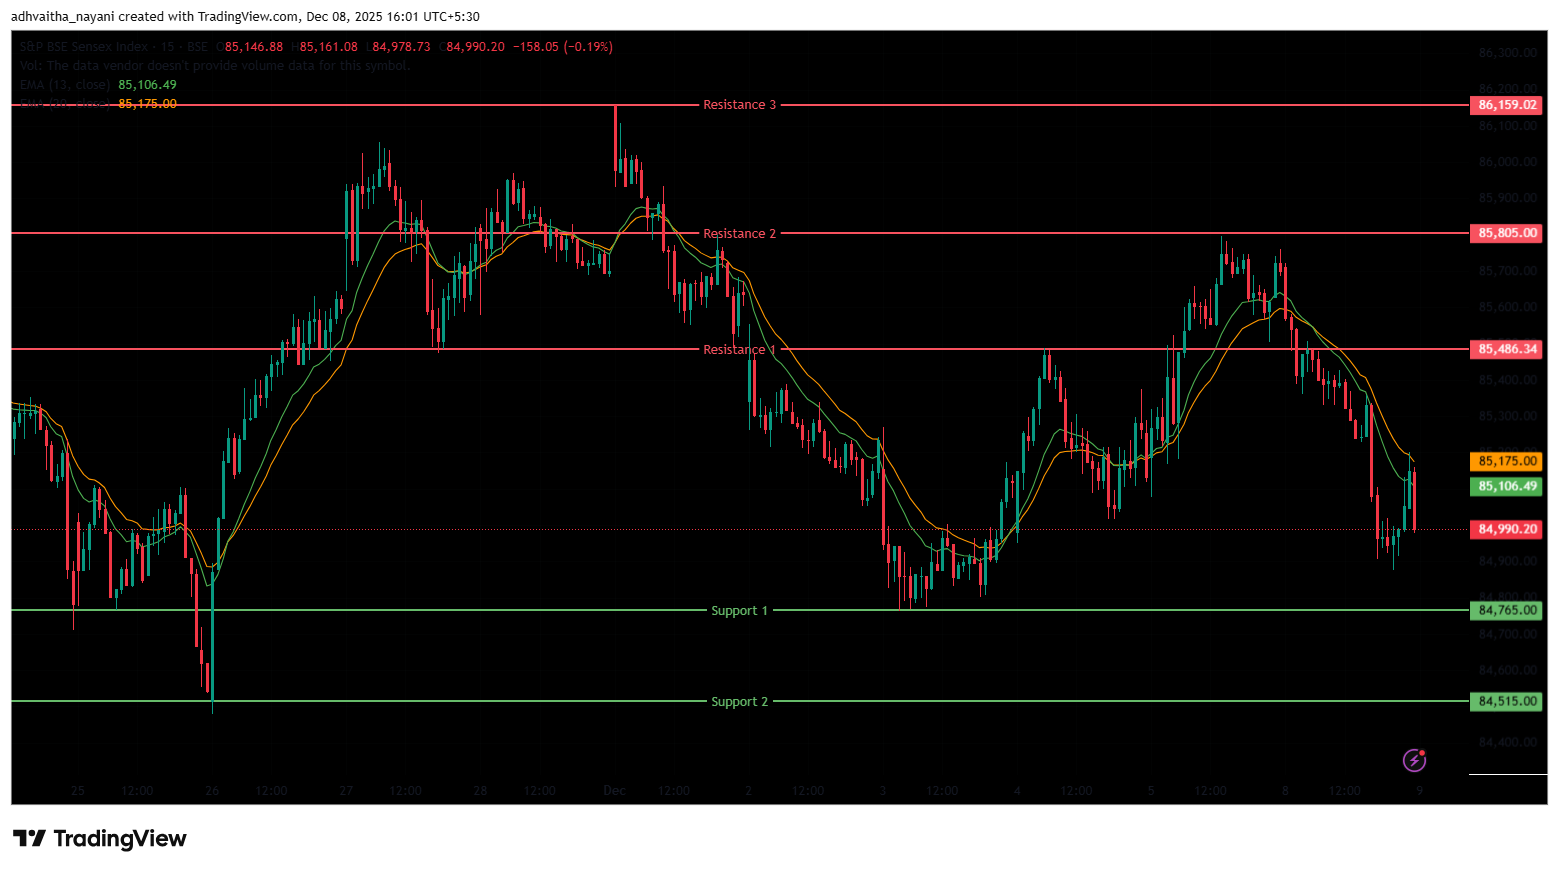
The BSE Sensex Index also opened on a negative note, opening at 85,624.84 on Monday, down by 87.53 points from Friday’s closing of 85,712.37. The Sensex index started the session on a bearish note below the 85,700 mark. The Index continued to move downwards, similar to Nifty 50 and Bank Nifty. During the morning session, the index was trading on an overall pessimistic note, in the range of 85,200 and 85,750.
In the afternoon session, the index further plunged down to 84,875.59, hitting its day low and was trading between 84,850 and 85,360. Finally, it had closed at 85,102.69 on a negative note, down 609.68 points or 0.71%. The Relative Strength Index (RSI) stood at 53.89, below the overbought zone of 70 in the daily time frame.
In the short term, the Index was above the 20-day EMA but below the 13-day EMA on the daily time frame and formed a strong bearish candle on Monday, with smaller wicks, indicating a negative outlook in the near term. The index faces immediate resistance at 85,486.34 (R1) and 85,805 (R2). The higher resistance is at 86,159.02 (R3), a level near its all-time high. On the downside, the nearest support lies at 84,765 (S1) and the next one at 84,515 (S2).
Trade Setup:
SensexResistance 386,159.02Resistance 285,805.00Resistance 185,486.34Closing Price85,102.69Support 184,765.00Support 284,515.00Market Recap on December 8th, 2025
On Monday, the Nifty 50 opened lower at 26,159.80, down by -26.65 points from its previous close of 26,186.45. The index hit an intraday low of 25,892.25 and closed on a bearish note, below the 26,000 level at 25,960.55, down -225.90 points, or -0.86%. The index closed above the 50/100/200-day EMAs, but below the 20-day EMA on the daily chart.
The BSE Sensex followed the same trajectory, opening on a negative trend at 85,624.84, down -87.53 points from the previous close of 85,712.37. It closed at 85,102.69, down -609.68 points, or -0.71%. Both indices showed short-term bearish momentum. RSI values for the Nifty 50 were at 51.16 and the Sensex at 53.89, below the overbought threshold of 70. The broader indices ended on a negative note, mainly due to profit-booking during Monday’s session.
On Monday, all the sectoral indices ended in red with no major gainers. The Nifty Realty index was the major loser, closing at 861.65, shedding -31.5 points or -3.53%. Godrej Properties Ltd was the major laggard, dropping -5.15%, followed by Prestige Estage Projects Ltd, DLF Ltd, Anant Raj Ltd and Sobha Ltd fell by up to 4.7%. The Nifty PSU Bank index was also among the major losers, falling -235.65 points or -2.81% to close at 8,146.10.
Among the PSU Banks, Punjab National Bank fell the most with a -4.69% loss, followed by Canara Bank, Indian Bank, and Bank of India, which fell up to -3.9%. The Nifty Media Index also dropped -39.20 or -2.73%, closing at 1,395.35. Asian equity markets closed mixed. Japan’s Nikkei 225 was flat at 50,486.00, with -5.87 points or -0.01%. Hong Kong’s Hang Seng Index dropped -328.08 points, or -1.27%, to 25,757.00. In contrast, China’s Shanghai Composite rose 21.27 points, or 0.54%, to 3,924.08, while South Korea’s KOSPI surged 54.80 points, or 1.32%, closing at 4,154.85.
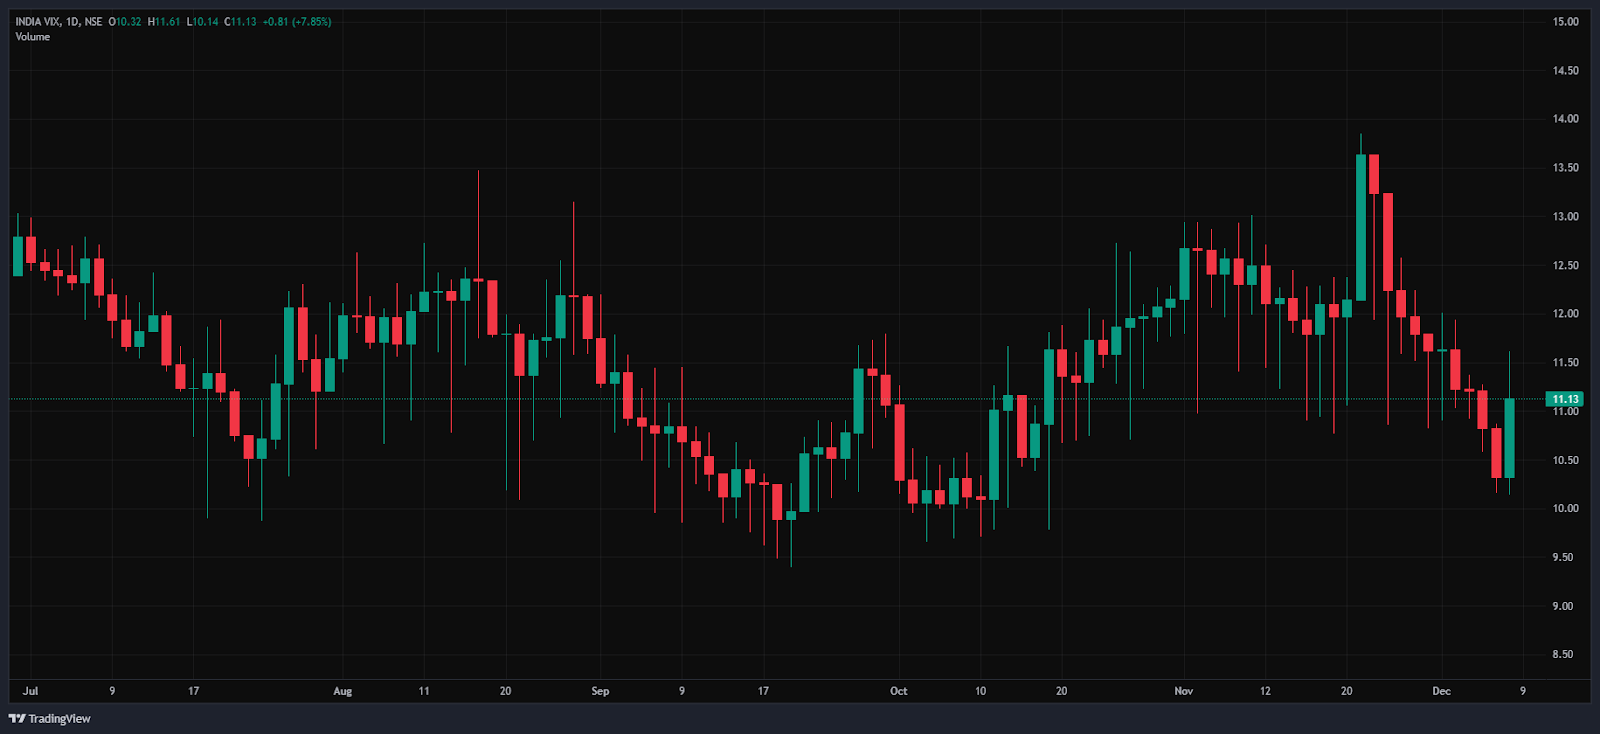
India VIX
The India VIX rose to 11.13, up by 0.81 points (7.85%) during Monday’s trading session, indicating an uptick in expected market volatility in the daily time frame. However, overall volatility remains low, since the India VIX is generally considered elevated only when it rises above 15.
Given the ongoing volatility and mixed sentiments, it’s advisable to avoid aggressive positions and wait for clear directional moves above resistance or below support. Traders should consider these key support and resistance levels when entering long or short positions following the price break from these critical levels. Additionally, traders can combine moving averages to identify more accurate entry and exit points.
DisclaimerThe views and investment tips expressed by investment experts/broking houses/rating agencies on tradebrains.in are their own, and not that of the website or its management. Investing in equities poses a risk of financial losses. Investors must therefore exercise due caution while investing or trading in stocks. Trade Brains Technologies Private Limited or the author are not liable for any losses caused as a result of the decision based on this article. Please consult your investment advisor before investing.
About: Trade Brains Portal is a stock analysis platform. Its trade name is Dailyraven Technologies Private Limited, and its SEBI-registered research analyst registration number is INH000015729.
Investments in securities are subject to market risks. Read all the related documents carefully before investing.
Registration granted by SEBI and certification from NISM in no way guarantee performance of the intermediary or provide any assurance of returns to investors.
The post Technical View: Nifty, Bank Nifty & Sensex Trade Setup and Key levels to watch for 9th December appeared first on Trade Brains.
Related Articles

Nikhil Kamath Portfolio: How Did Nazara Tech and 2 Other Stocks Perform in Q3?
Synopsis: Nikhil Kamath’s Q3 portfolio comprises three key listed holdings, Naza...

Stock To Buy: CDMO Stock With 40% Upside and Strong Growth Momentum
Synopsis:- ICICI Direct maintains a Buy with ₹1,310 target, implying 38% upside....

Atlanta Electricals: Why This Smallcap Stock May Gain From the Power Sector Boom
Synopsis: Atlanta Electricals, a small-cap company, is riding the waves of the p...

High FII Holdings: Paytm and 4 Other Stocks With FII Stake Above 50%
Synopsis: Several large-cap stocks show strong foreign investor confidence, with...