XRP Price Dips Under Crucial Support, Putting Spotlight on Lower Price Targets
Alex Smith
2 months ago
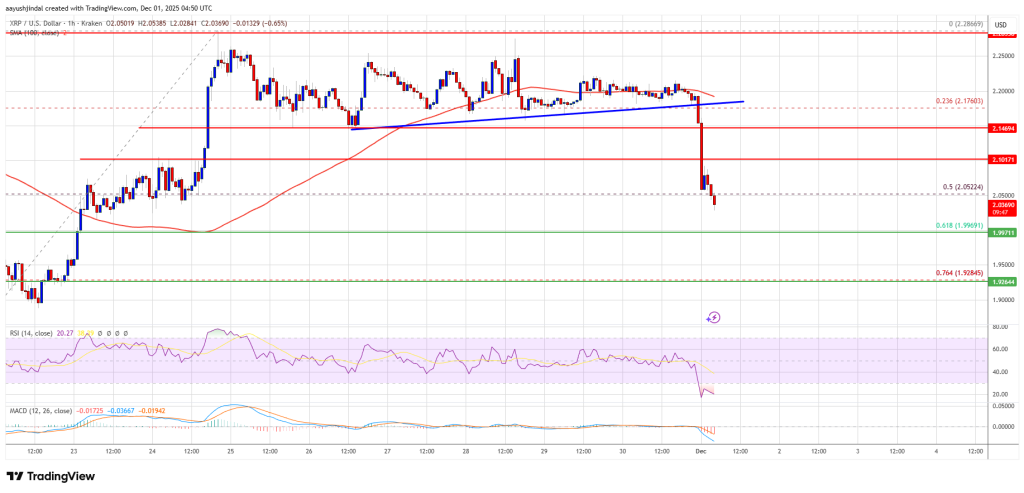
XRP price started a fresh decline below $2.150. The price is now struggling and faces resistance near the $2.10 pivot level.
- XRP price started a fresh decline below the $2.150 zone.
- The price is now trading below $2.120 and the 100-hourly Simple Moving Average.
- There was a break below a key bullish trend line with support at $2.180 on the hourly chart of the XRP/USD pair (data source from Kraken).
- The pair could continue to move down if it settles below $2.00.
XRP Price Dips Again
XRP price attempted a recovery wave above $2.150 but failed to continue higher, like Bitcoin and Ethereum. The price started a fresh decline below $2.120 and $2.10.
There was a move below the 50% Fib retracement level of the upward move from the $1.817 swing low to the $2.286 high. Besides, there was a break below a key bullish trend line with support at $2.180 on the hourly chart of the XRP/USD pair.
The price is now trading below $2.10 and the 100-hourly Simple Moving Average. If there is a fresh upward move, the price might face resistance near the $2.080 level. The first major resistance is near the $2.10 level. A close above $2.10 could send the price to $2.120. The next hurdle sits at $2.150. A clear move above the $2.150 resistance might send the price toward the $2.20 resistance. Any more gains might send the price toward the $2.250 resistance. The next major hurdle for the bulls might be near $2.320.
More Losses?
If XRP fails to clear the $2.10 resistance zone, it could start a fresh decline. Initial support on the downside is near the $2.00 level or the 61.8% Fib retracement level of the upward move from the $1.817 swing low to the $2.286 high. The next major support is near the $1.9250 level.
If there is a downside break and a close below the $1.9250 level, the price might continue to decline toward $1.850. The next major support sits near the $1.820 zone, below which the price could continue lower toward $1.80.
Technical Indicators
Hourly MACD – The MACD for XRP/USD is now gaining pace in the bearish zone.
Hourly RSI (Relative Strength Index) – The RSI for XRP/USD is now below the 50 level.
Major Support Levels – $2.00 and $1.9250.
Major Resistance Levels – $2.10 and $2.120.
Related Articles

Uniswap Vindicated in Patent Lawsuit, Highlighting LiquidChain’s Booming Presale
What to Know: Uniswap’s legal victory over Bancor in a patent infringement...

Stripe’s New X402 Protocol for AI Agents Spotlights a Booming Trend, Fueling SUBBD Token’s Presale
What to Know: Stripe is testing a new crypto protocol (X402) on Base to let AI a...

Tokenized Commodities Swell Past $6B as Gold Shines and New Contender $MAXI Builds Momentum
What to Know: The market for tokenized commodities has blown past $6B, mostly th...
These Three Catalysts Could Spark Bitcoin’s Next Rally, According To Wintermute
Crypto market maker Wintermute published a detailed market update on Tuesday via...