XRP Price Pulls Back After Rally, Traders Eye Buy-the-Dip Setup
Alex Smith
2 hours ago
XRP price failed to stay above $1.460 and started a downside correction. The price is now holding the $1.3880 support and might aim for another increase.
- XRP price started a downside correction and declined below $1.4450.
- The price is now trading above $1.380 and the 100-hourly Simple Moving Average.
- There is a key declining channel forming with resistance at $1.430 on the hourly chart of the XRP/USD pair (data source from Kraken).
- The pair could start another increase if it stays above $1.3880.
XRP Price Dips To Support
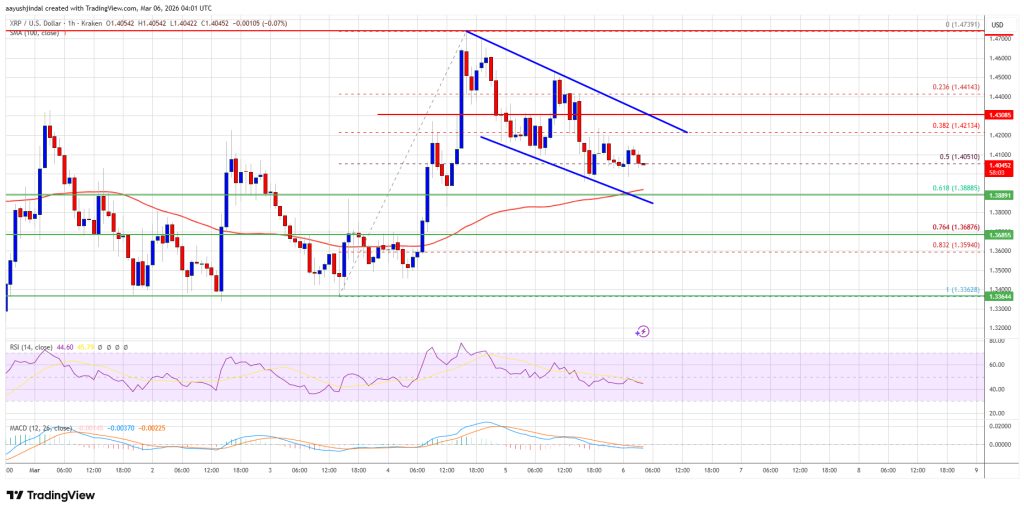
XRP price failed to stay above $1.450 and started a downside correction, like Bitcoin and Ethereum. The price dipped below the $1.4450 and $1.4320 levels to enter a negative zone.
The price even dipped below the 50% Fib retracement level of the upward move from the $1.3362 swing low to the $1.4739 high. Besides, there is a key declining channel forming with resistance at $1.430 on the hourly chart of the XRP/USD pair.
The bulls are now active above the $1.3880 zone. The price is now trading below $1.40 and the 100-hourly Simple Moving Average. If there is a fresh upward move, the price might face resistance near the $1.420 level. The first major resistance is near the $1.430 level, above which the price could rise and test $1.450.
A clear move above the $1.450 resistance might send the price toward the $1.4720 resistance. Any more gains might send the price toward the $1.50 resistance. The next major hurdle for the bulls might be near $1.5250.
More Losses?
If XRP fails to clear the $1.430 resistance zone, it could start a fresh decline. Initial support on the downside is near the $1.40 level. The next major support is near the $1.3880 level and the 61.8% Fib retracement level of the upward move from the $1.3362 swing low to the $1.4739 high.
If there is a downside break and a close below the $1.3880 level, the price might continue to decline toward $1.3680. The next major support sits near the $1.350 zone, below which the price could continue lower toward $1.3350.
Technical Indicators
Hourly MACD – The MACD for XRP/USD is now losing pace in the bullish zone.
Hourly RSI (Relative Strength Index) – The RSI for XRP/USD is now below the 50 level.
Major Support Levels – $1.4000 and $1.3880.
Major Resistance Levels – $1.4300 and $1.4500.
Related Articles
Bank Resistance Puts 2026 Passage Of Crypto Market Structure Bill In Doubt, Reuters
In a report published Thursday, Reuters said the long-anticipated crypto market...

Bitcoin Spot ETFs See 14-Day Netflows Surge: Demand Returning?
Data shows the Bitcoin spot exchange-traded funds (ETFs) have seen their 14-day...
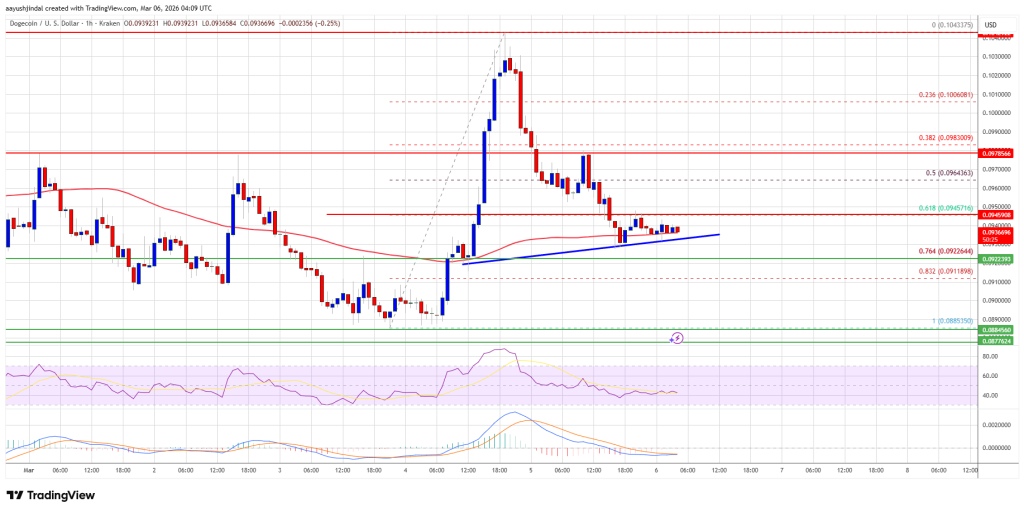
Dogecoin (DOGE) Retreats, Market Eyes Potential Extended Pullback
Dogecoin corrected some gains and traded below $0.10 against the US Dollar. DOGE...
XRP Faces High Risk Of Breakdown Below $1.30, Expert Flags Bitcoin As Main Threat
XRP has climbed back above the $1.40 mark this week, a level that previously act...