XRP Price Rebound Fizzles Out, Downside Pressure Returns Fast
Alex Smith
3 hours ago
XRP price started a downside correction from the $1.3550 zone. The price is now consolidating and might aim for another increase if it stays above the $1.30 zone.
- XRP price started a downside correction after it failed to clear the $1.3550 zone.
- The price is now trading below $1.3220 and the 100-hourly Simple Moving Average.
- There is a bearish trend line forming with resistance at $1.3380 on the hourly chart of the XRP/USD pair (data source from Kraken).
- The pair could continue to move up if it settles above $1.340.
XRP Price Holds Support
XRP price started a decent upward move above $1.3220 and $1.3250, like Bitcoin and Ethereum. The price gained pace for a clear move above the $1.3420 resistance.
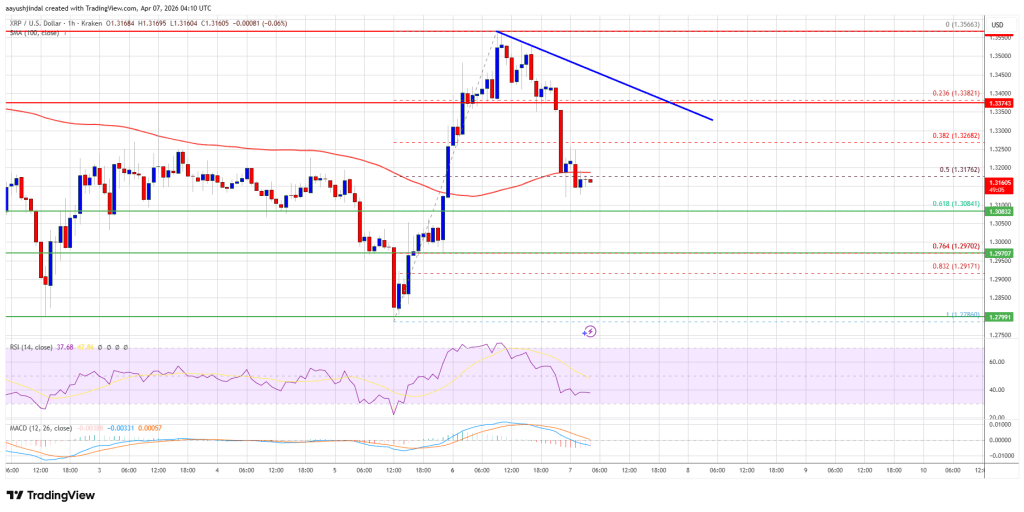
A high was formed at $1.3566, and the price started a downside correction. There was a move below $1.350 and $1.340. The price dipped below the 50% Fib retracement level of the upward move from the $1.2786 swing low to the $1.3566 high.
However, the bulls were active above $1.3080 and the 61.8% Fib retracement level of the upward move from the $1.2786 swing low to the $1.3566 high. The price is now trading below $1.3220 and the 100-hourly Simple Moving Average.
If there is a fresh upward move, the price might face resistance near the $1.3250 level. The first major resistance is near the $1.3380 level. There is also a bearish trend line forming with resistance at $1.3380 on the hourly chart of the XRP/USD pair, above which the price could rise and test $1.3550.
A clear move above the $1.3550 resistance might send the price toward the $1.380 resistance. Any more gains might send the price toward the $1.40 resistance. The next major hurdle for the bulls might be near $1.4250.
Another Drop?
If XRP fails to clear the $1.3380 resistance zone, it could start a fresh decline. Initial support on the downside is near the $1.3080 level. The next major support is near the $1.30 level.
If there is a downside break and a close below the $1.30 level, the price might continue to decline toward $1.2880. The next major support sits near the $1.2620 zone, below which the price could continue lower toward $1.250. Any more losses might call for a test of $1.2350.
Technical Indicators
Hourly MACD – The MACD for XRP/USD is now gaining pace in the bearish zone.
Hourly RSI (Relative Strength Index) – The RSI for XRP/USD is now below the 50 level.
Major Support Levels – $1.3080 and $1.3000.
Major Resistance Levels – $1.3380 and $1.3550.
Related Articles

Bitcoin Next Big Move In Mid-April? Analyst Explains Why ‘Decision Time’ Could Be Near
As Bitcoin (BTC) attempts to reclaim a key resistance area, an analyst has sugge...

These 3 Signals Mark Bear Market Exits—Bitcoin Has Yet To Trigger Them
Bitcoin is still far from triggering the three signals that have historically ap...
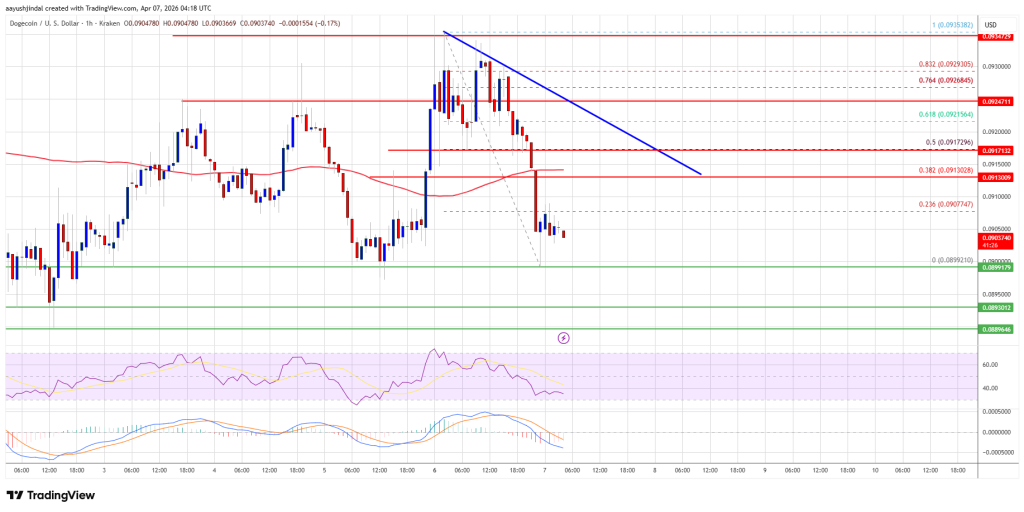
Dogecoin (DOGE) Under Threat, Downside Thrust Could Trigger Selloff
Dogecoin started a fresh decline below the $0.0920 zone against the US Dollar. D...

Litecoin Eyes Breakout: Ending Diagonal Hints At New Highs Ahead
Litecoin is showing signs of a potential breakout, as its current price structur...