XRP Price Reversal Gathers Speed, Downside Pressure Intensifies
Alex Smith
2 hours ago
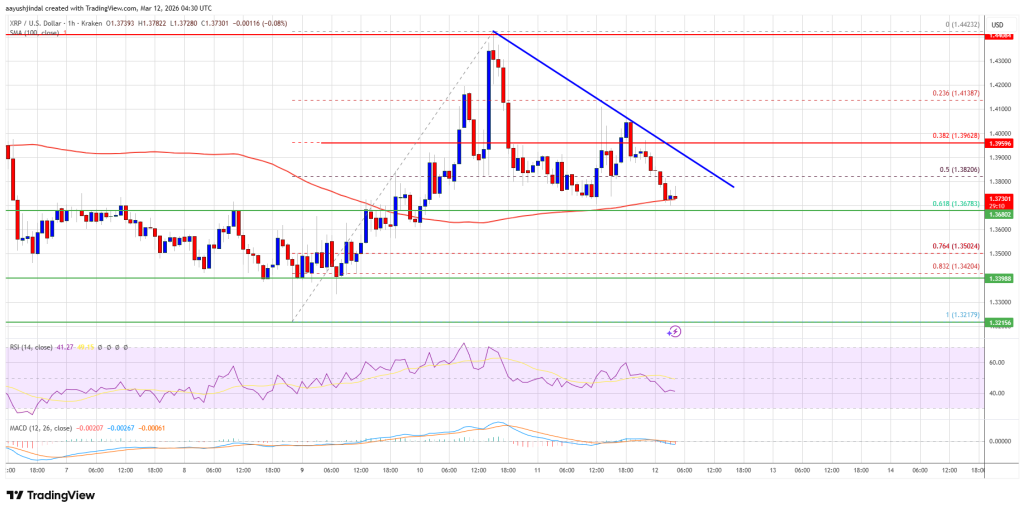
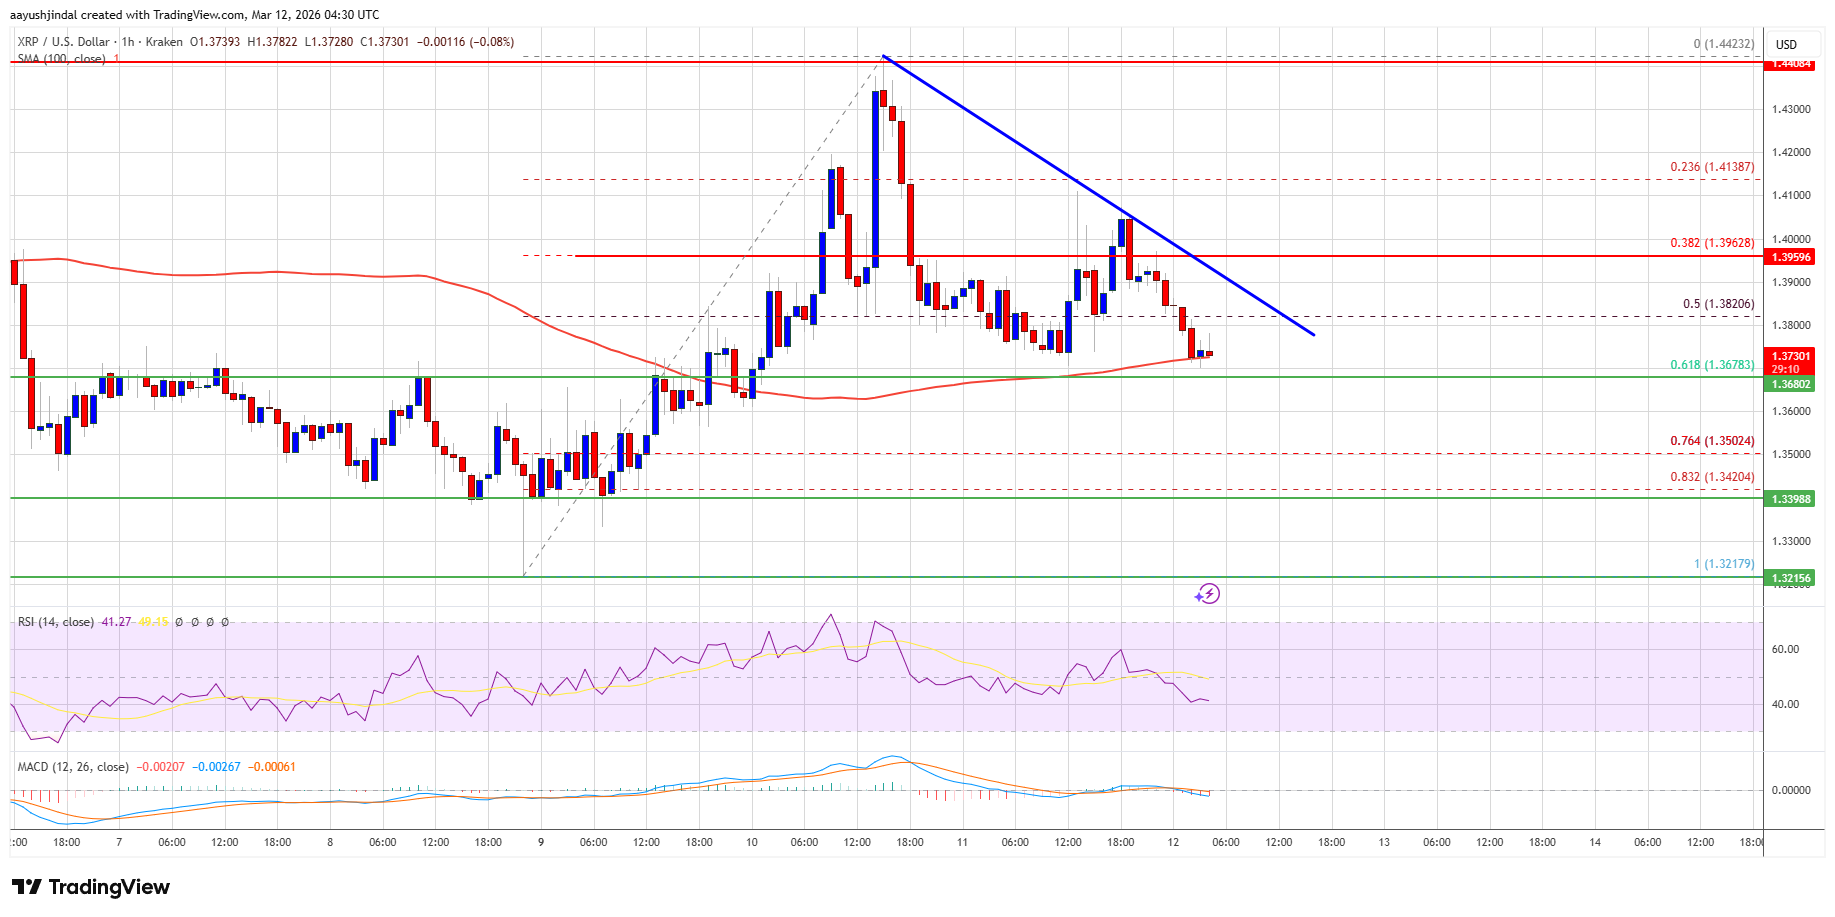
XRP price failed to stay above $1.3950 and started a downside correction. The price is now holding the $1.3680 support but is at risk of more losses.
- XRP price started a downside correction and declined below $1.4050.
- The price is now trading near $1.3720 and the 100-hourly Simple Moving Average.
- There is a new bearish trend line forming with resistance at $1.3910 on the hourly chart of the XRP/USD pair (data source from Kraken).
- The pair could start another increase if it stays above $1.3680.
XRP Price Corrects Gains
XRP price failed to stay above $1.4120 and started a downside correction, like Bitcoin and Ethereum. The price dipped below the $1.4050 and $1.4020 levels to enter a negative zone.
The price even dipped below the 50% Fib retracement level of the upward move from the $1.3217 swing low to the $1.4430 high. Besides, there is a new bearish trend line forming with resistance at $1.3910 on the hourly chart of the XRP/USD pair.
The price is now trading near $1.3720 and the 100-hourly Simple Moving Average. If there is a fresh upward move, the price might face resistance near the $1.3840 level. The first major resistance is near the $1.3920 level, above which the price could rise and test $1.40.
A clear move above the $1.40 resistance might send the price toward the $1.4140 resistance. Any more gains might send the price toward the $1.4250 resistance. The next major hurdle for the bulls might be near $1.450.
More Downside?
If XRP fails to clear the $1.40 resistance zone, it could start a fresh decline. Initial support on the downside is near the $1.370 level. The next major support is near the $1.3680 level and the 61.8% Fib retracement level of the upward move from the $1.3217 swing low to the $1.4430 high.
If there is a downside break and a close below the $1.3680 level, the price might continue to decline toward $1.340. The next major support sits near the $1.3250 zone, below which the price could continue lower toward $1.3120. Any more losses might call for a test of $1.3050.
Technical Indicators
Hourly MACD – The MACD for XRP/USD is now gaining pace in the bearish zone.
Hourly RSI (Relative Strength Index) – The RSI for XRP/USD is now below the 50 level.
Major Support Levels – $1.3680 and $1.3250.
Major Resistance Levels – $1.3910 and $1.4000.
Related Articles
White House Crypto Advisor Denounces Attempts To Sabotage CLARITY Act’s Goals
No progress has been made recently on the delayed CLARITY Act, the crypto market...
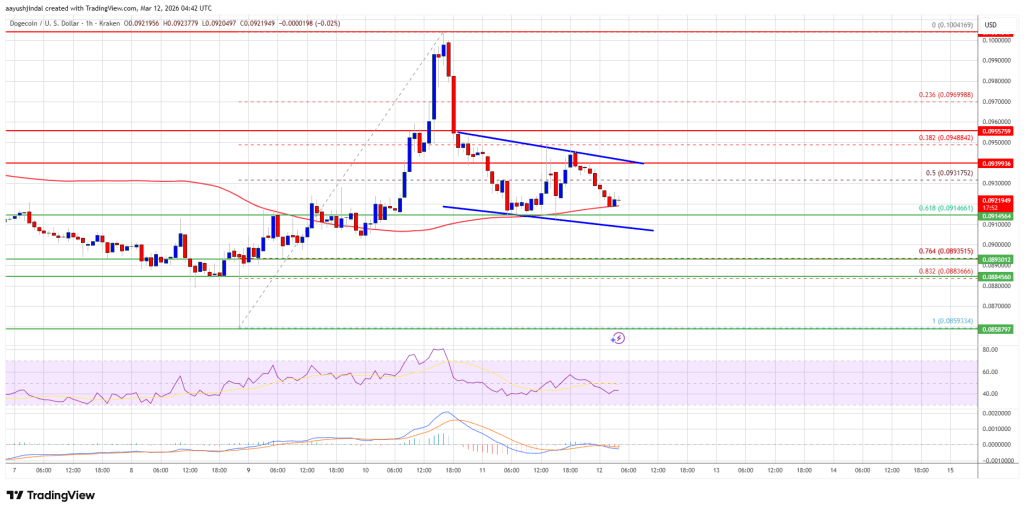
Dogecoin (DOGE) Pullback Sparks Tension — Will Support Hold?
Dogecoin corrected some gains and traded below $0.0950 against the US Dollar. DO...

Hyperliquid Looks Like Solana At $20 Last Cycle, Daniel Cheung Says
Daniel Cheung, co-founder of Syncracy Capital, says Hyperliquid’s native token H...

The $2,050 Pivot: Ethereum Scarcity Index Turns Positive As Binance Supply Tightens
Ethereum is trading slightly above the $2,000 level as the market continues to n...