XRP Price Revisits Support Range, Make-Or-Break Moment For Bulls
Alex Smith
3 hours ago

XRP price extended losses and traded below $1.440. The price is now consolidating losses and faces hurdles near $1.4375 and $1.4450.
- XRP price started another decline and traded below the $1.440 zone.
- The price is now trading below $1.4250 and the 100-hourly Simple Moving Average.
- There was a break below a bullish trend line with support at $1.4240 on the hourly chart of the XRP/USD pair (data source from Kraken).
- The pair could continue to move down if it stays below $1.440.
XRP Price Dips Again
XRP price failed to stay above $1.450 and extended its decline, underperforming Bitcoin and Ethereum. The price declined below $1.4420 and $1.440 to enter a short-term bearish zone.
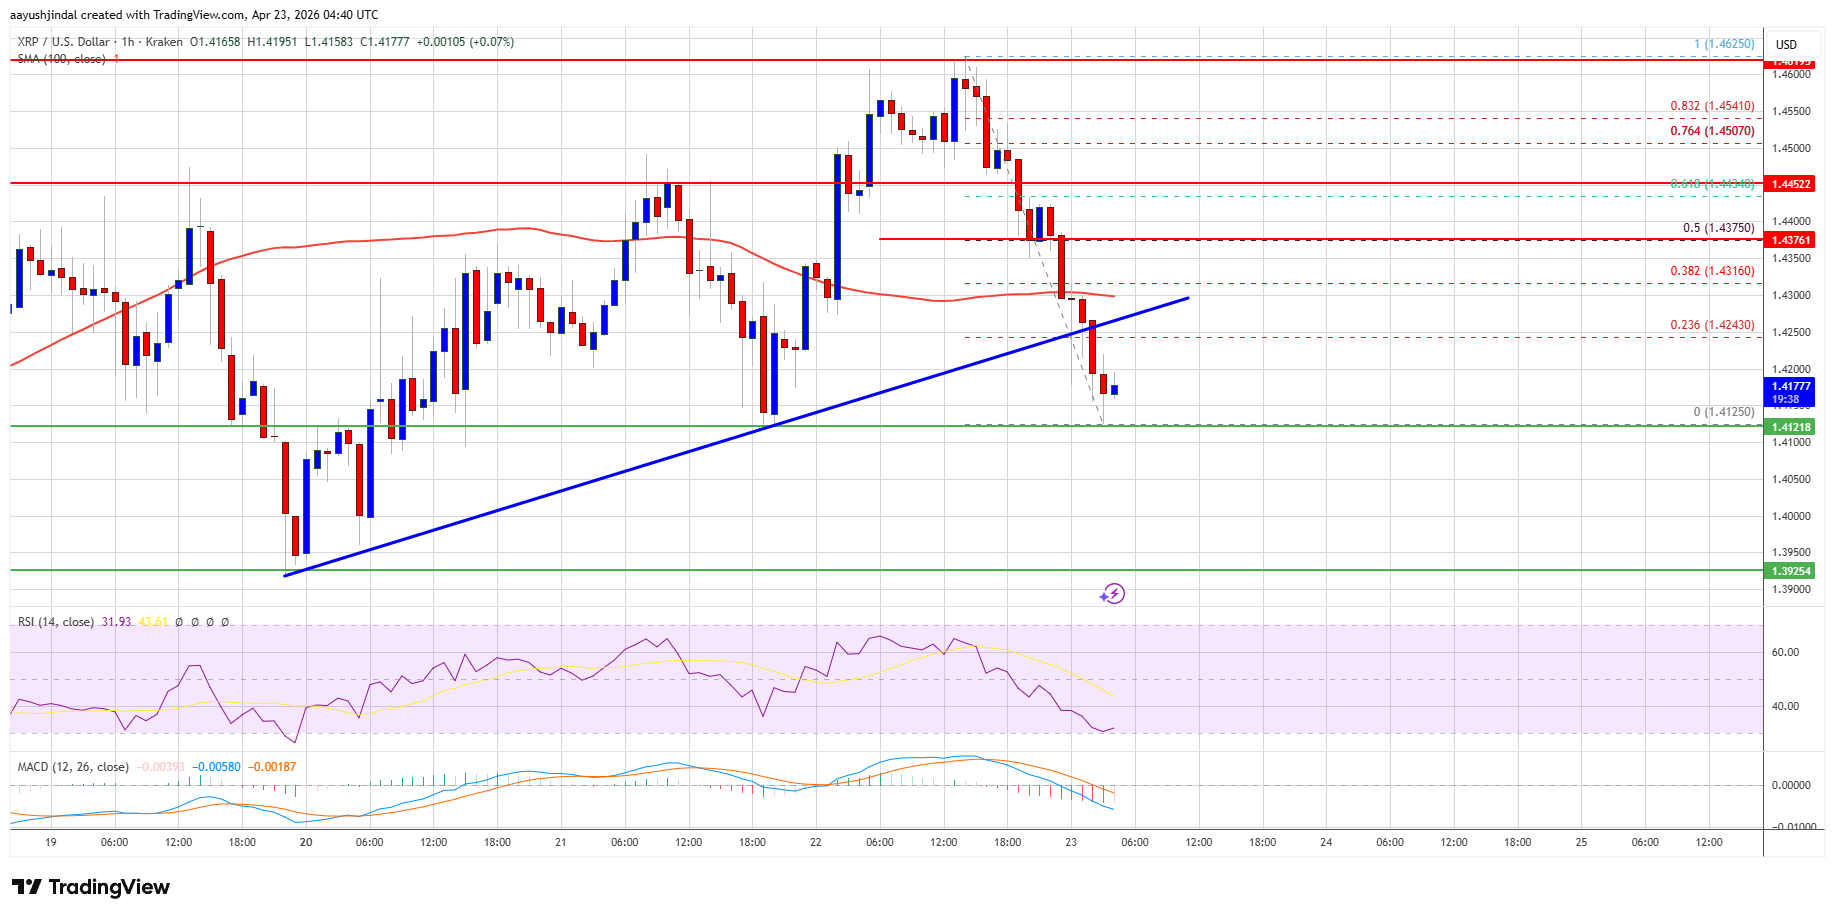
There was a break below a bullish trend line with support at $1.4240 on the hourly chart of the XRP/USD pair. The price even extended losses below $1.420. A low was formed at $1.4125, and the price is now consolidating losses below the 23.6% Fib retracement level of the downward move from the $1.4625 swing high to the $1.4125 low.
The price is now trading below $1.4350 and the 100-hourly Simple Moving Average. If there is a fresh recovery move, the price might face resistance near the $1.4240 level.
The first major resistance is near the $1.4375 level or the 50% Fib retracement level of the downward move from the $1.4625 swing high to the $1.4125 low. The main resistance could be $1.4450. A close above $1.4450 could send the price to $1.4550. The next hurdle sits at $1.4620. A clear move above the $1.4620 resistance might send the price toward the $1.50 resistance. Any more gains might send the price toward the $1.5150 resistance.
More Losses?
If XRP fails to clear the $1.4375 resistance zone, it could start a fresh decline. Initial support on the downside is near the $1.4120 level. The next major support is near the $1.40 level.
If there is a downside break and a close below the $1.40 level, the price might continue to decline toward $1.3840. The next major support sits near the $1.3650 zone, below which the price could continue lower toward $1.3440.
Technical Indicators
Hourly MACD – The MACD for XRP/USD is now gaining pace in the bearish zone.
Hourly RSI (Relative Strength Index) – The RSI for XRP/USD is now below the 50 level.
Major Support Levels – $1.4120 and $1.4000.
Major Resistance Levels – $1.4375 and $1.4550.
Related Articles
Bitcoin Rally Catches Shorts Offside—$200M Liquidated As Price Hits $79,000
Data shows a large amount of Bitcoin short positions have been liquidated follow...

Ethereum Faces ‘Moment Of Truth’ As Price Eyes $2,450 Resistance – Breakout Loading?
Some crypto analysts have affirmed that Ethereum (ETH) is facing a pivotal momen...
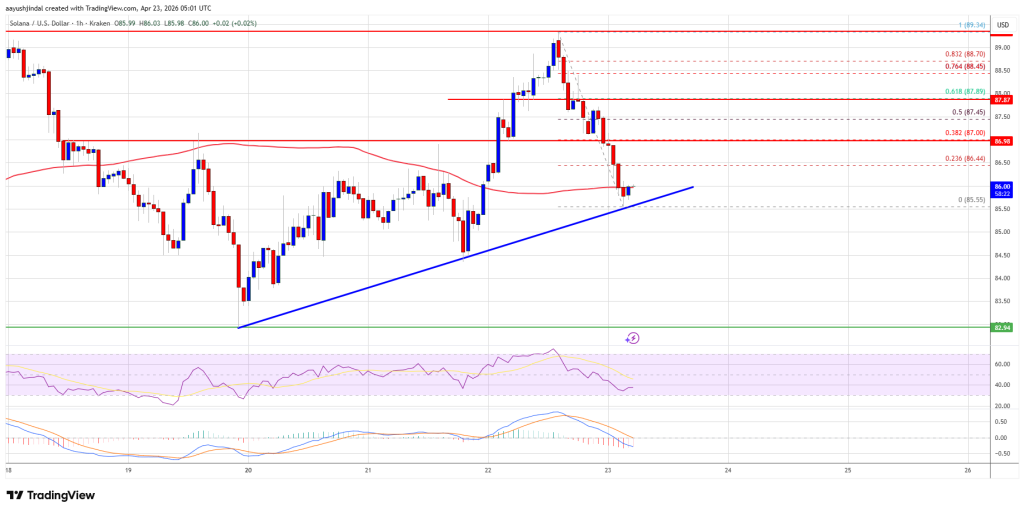
Solana (SOL) Strength Fades, Will Bulls Regain Momentum Soon?
Solana failed to settle above $90 and corrected most gains. SOL price is now con...
Bitcoin Watch: All Eyes On $86,000—What Could Fuel The Next Bullish Breakout
Bitcoin (BTC) pushed higher on Wednesday, extending its recovery rally to levels...