XRP Price Slides Sharply Lower As Selling Pressure Intensifies Rapidly
Alex Smith
1 hour ago
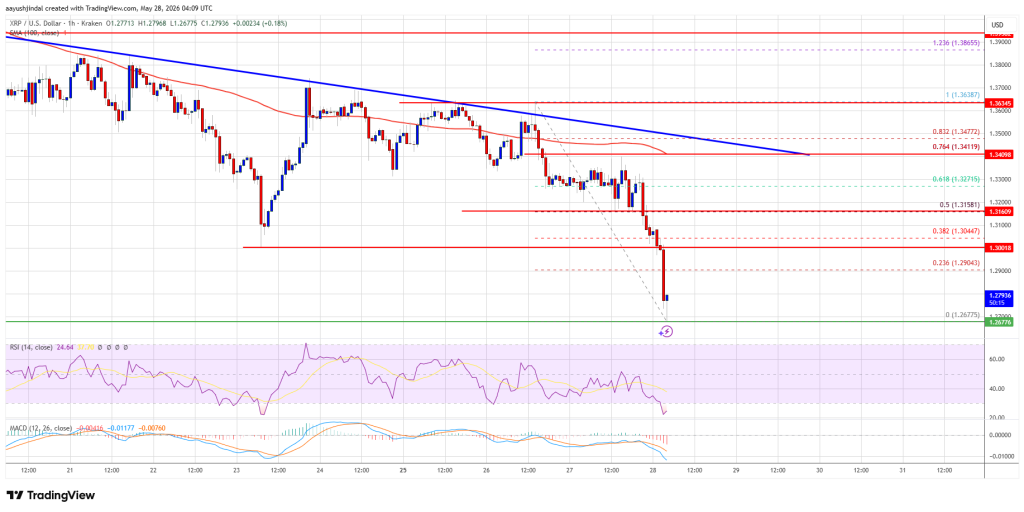
XRP price extended losses and traded below $1.30. The price is now consolidating losses and faces hurdles near $1.30 and $1.340.
- XRP price started another decline and traded below the $1.30 zone.
- The price is now trading below $1.30 and the 100-hourly Simple Moving Average.
- There is a bearish trend line forming with resistance at $1.340 on the hourly chart of the XRP/USD pair (data source from Kraken).
- The pair could continue to move down if it stays below $1.340.
XRP Price Dips Below $1.30
XRP price failed to stay above $1.340 and extended its decline, like Bitcoin and Ethereum. The price declined below $1.3250 and $1.3120 to enter a short-term bearish zone.
The price even extended losses below $1.30. A low was formed at $1.2677, and the price is now consolidating losses well below the 23.6% Fib retracement level of the downward move from the $1.3638 swing high to the $1.2677 low.
The price is now trading below $1.30 and the 100-hourly Simple Moving Average. If there is a fresh recovery move, the price might face resistance near the $1.290 level. The first major resistance is near the $1.30 level. The main resistance could be $1.3150 or the 50% Fib retracement level of the downward move from the $1.3638 swing high to the $1.2677 low.

A close above $1.3150 could send the price to $1.3275. The next hurdle sits at $1.340. There is also a bearish trend line forming with resistance at $1.340 on the hourly chart of the XRP/USD pair. A clear move above the $1.340 resistance might send the price toward the $1.3550 resistance. Any more gains might send the price toward the $1.3750 resistance.
More Losses?
If XRP fails to clear the $1.3150 resistance zone, it could start a fresh decline. Initial support on the downside is near the $1.2675 level. The next major support is near the $1.2550 level.
If there is a downside break and a close below the $1.2550 level, the price might continue to decline toward $1.2320. The next major support sits near the $1.220 zone, below which the price could continue lower toward $1.20.
Technical Indicators
Hourly MACD – The MACD for XRP/USD is now gaining pace in the bearish zone.
Hourly RSI (Relative Strength Index) – The RSI for XRP/USD is now below the 50 level.
Major Support Levels – $1.2675 and $1.2550.
Major Resistance Levels – $1.3150 and $1.3400.
Related Articles

Solana (SOL) Plunges Lower, Market Sentiment Turns Sharply Bearish
Solana failed to settle above $85 and trimmed most gains. SOL price is now conso...

Bitcoin’s 4-Year Rhythm Is Still Playing Out, Says Crypto CEO
A countertrend rally that pushed Bitcoin to $82,800 has done little to change on...

Bitcoin Sends An Unusual Signal After Miner Inflows Top 20,000 BTC – Analyst Explains The Setup
Bitcoin is struggling to reclaim higher levels as the price tests the $76,000 le...
Ethereum Price Struggles Near Key Levels As Market Sentiment Weakens
Ethereum price started a fresh decline and traded below $2,050. ETH is now conso...