XRP Price Stabilizes After Flash Crash, Market Watches Closely
Alex Smith
3 weeks ago

XRP price extended losses and traded dived $2.00. The price is now consolidating and might decline further if it remains below $2.00.
- XRP price started a fresh decline below the $2.00 zone.
- The price is now trading below $2.00 and the 100-hourly Simple Moving Average.
- There was a break below a contracting triangle with support at $2.050 on the hourly chart of the XRP/USD pair (data source from Kraken).
- The pair could continue to move down if it stays below $2.00.
XRP Price Dips Sharply
XRP price failed to stay above $2.10 and started a fresh decline, like Bitcoin and Ethereum. The price declined below $2.020 and $2.00 to enter a short-term bearish zone.
There was a break below a contracting triangle with support at $2.050 on the hourly chart of the XRP/USD pair. The price even spiked below $1.880. A low was formed at $1.847, and the price is now consolidating losses. There was a recovery wave above $1.920. The price even tested the 50% Fib retracement level of the downward move from the $2.065 swing high to the $1.847 low, but the bears remained active.
The price is now trading below $2.00 and the 100-hourly Simple Moving Average. If there is a fresh upward move, the price might face resistance near the $1.980 level and the 61.8% Fib retracement level of the downward move from the $2.065 swing high to the $1.847 low.
The first major resistance is near the $2.00 level. A close above $2.00 could send the price to $2.065. The next hurdle sits at $2.10. A clear move above the $2.10 resistance might send the price toward the $2.120 resistance. Any more gains might send the price toward the $2.150 resistance. The next major hurdle for the bulls might be near $2.20.
More Losses?
If XRP fails to clear the $2.00 resistance zone, it could start a fresh decline. Initial support on the downside is near the $1.9320 level. The next major support is near the $1.90 level.
If there is a downside break and a close below the $1.90 level, the price might continue to decline toward $1.850. The next major support sits near the $1.820 zone, below which the price could continue lower toward $1.80.
Technical Indicators
Hourly MACD – The MACD for XRP/USD is now losing pace in the bearish zone.
Hourly RSI (Relative Strength Index) – The RSI for XRP/USD is now below the 50 level.
Major Support Levels – $1.920 and $1.90.
Major Resistance Levels – $1.980 and $2.00.
Related Articles

Bitcoin Realized Losses Hit Luna Crash Levels — But Price Context Points To A Different Market Phase
Bitcoin is facing renewed selling pressure after losing the key $70,000 level, a...

XRP Slips 4% Amid Policy Uncertainty, but Analysts Say a Major Move Is Brewing
XRP’s price has drifted lower this week, slipping roughly 4.5% and trading below...
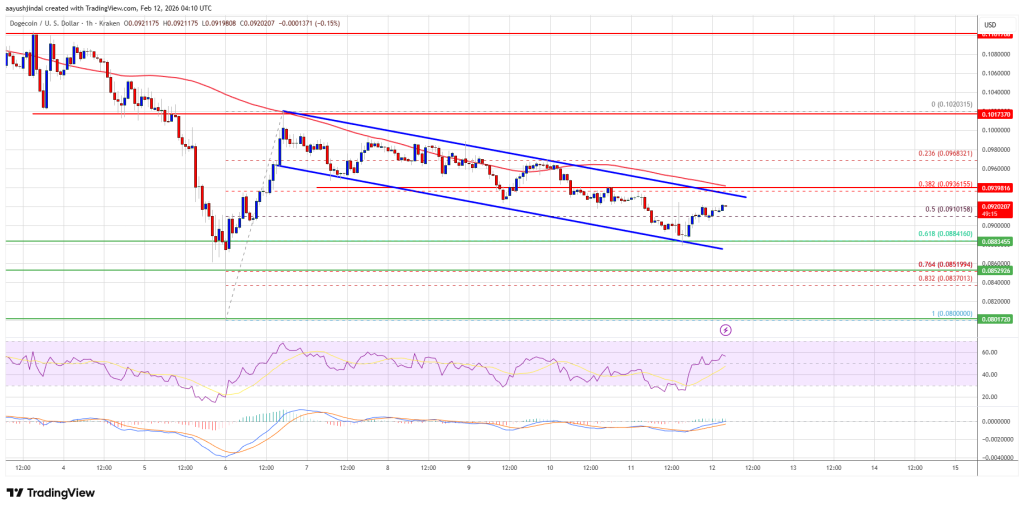
Dogecoin (DOGE) Stumbles Lower, Market Awaits Trend Shift Signal
Dogecoin corrected some gains and traded below $0.0950 against the US Dollar. DO...

Long-Term Ethereum Holders Expand Positions While Market Faces Pressure: Rare Signal Emerges
Ethereum has slipped below the key $2,000 level again, reflecting renewed sellin...