XRP Price Trims Upside, Slow Decline Signals Seller Dominance
Alex Smith
1 month ago
XRP price started a decent increase above $1.920. The price is now correcting gains and might struggle to stay in a positive zone.
- XRP price started a downside correction and tested the $1.880 zone.
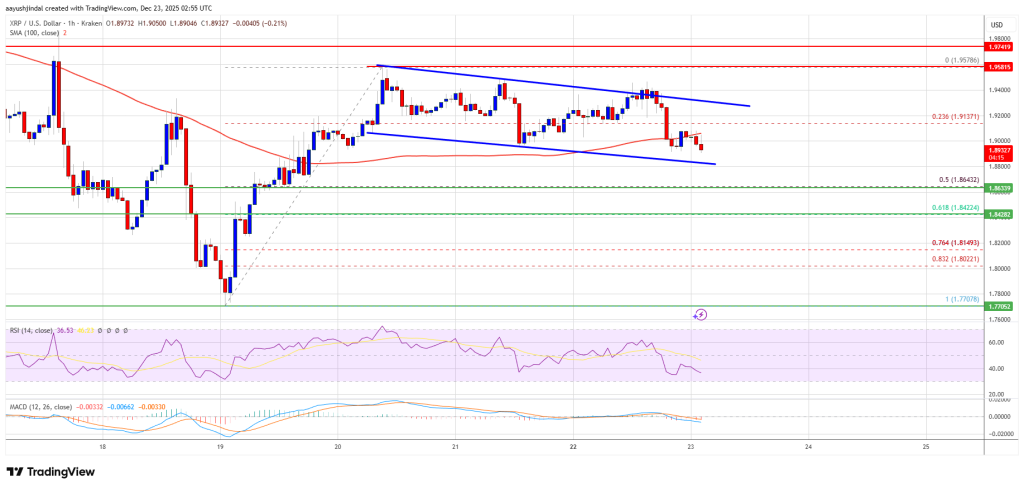
- The price is now trading below $1.90 and the 100-hourly Simple Moving Average.
- There is a declining channel or a possible bullish flag pattern forming with resistance at $1.9250 on the hourly chart of the XRP/USD pair (data source from Kraken).
- The pair could start another increase if it clears $1.950.
XRP Price Fails At Resistance
XRP price started a downside correction from the $1.950 zone, like Bitcoin and Ethereum. The price dipped below the $1.920 and $1.90 levels to enter a consolidation phase.
The price even dipped below the 23.6% Fib retracement level of the upward move from the $1.770 swing low to the $1.9578 high. However, there is a declining channel or a possible bullish flag pattern forming with resistance at $1.9250 on the hourly chart of the XRP/USD pair.
The price is now trading below $1.90 and the 100-hourly Simple Moving Average. If there is a fresh upward move, the price might face resistance near the $1.90 level. The first major resistance is near the $1.920 level, above which the price could rise and test $1.950. A clear move above the $1.950 resistance might send the price toward the $2.00 resistance. Any more gains might send the price toward the $2.050 resistance. The next major hurdle for the bulls might be near $2.120.
More Losses?
If XRP fails to clear the $1.920 resistance zone, it could start a fresh decline. Initial support on the downside is near the $1.8650 level and the 50% Fib retracement level of the upward move from the $1.770 swing low to the $1.9578 high. The next major support is near the $1.8420 level.
If there is a downside break and a close below the $1.8420 level, the price might continue to decline toward $1.8150. The next major support sits near the $1.770 zone, below which the price could continue lower toward $1.720.
Technical Indicators
Hourly MACD – The MACD for XRP/USD is now gaining pace in the bearish zone.
Hourly RSI (Relative Strength Index) – The RSI for XRP/USD is now below the 50 level.
Major Support Levels – $1.8650 and $1.8420.
Major Resistance Levels – $1.920 and $1.950.
Related Articles

Bitcoin Price Bleeds Lower With $65K Becoming The Battleground
Bitcoin price failed to stay above $70,000 and started another decline. BTC is n...
Is Bitcoin A Better Investment Than Gold? Finance Expert Shares Deep Insights
Robert Kiyosaki, the author of Rich Dad Poor Dad, has once again declared his su...

XRP Wave 4 Bounce Gains Steam — Final Shakeout Still Ahead?
XRP is showing strength in its Wave 4 bounce following last week’s sharp sell-of...
How Much Would You Have If You Put $500 In Bitcoin In 2014 Vs. XRP?
XRP and Bitcoin (BTC) were pitted against each other in a recent analysis, with...