XRP Price Tumbles Under $1.22 As Market Sentiment Turns Sour
Alex Smith
1 hour ago

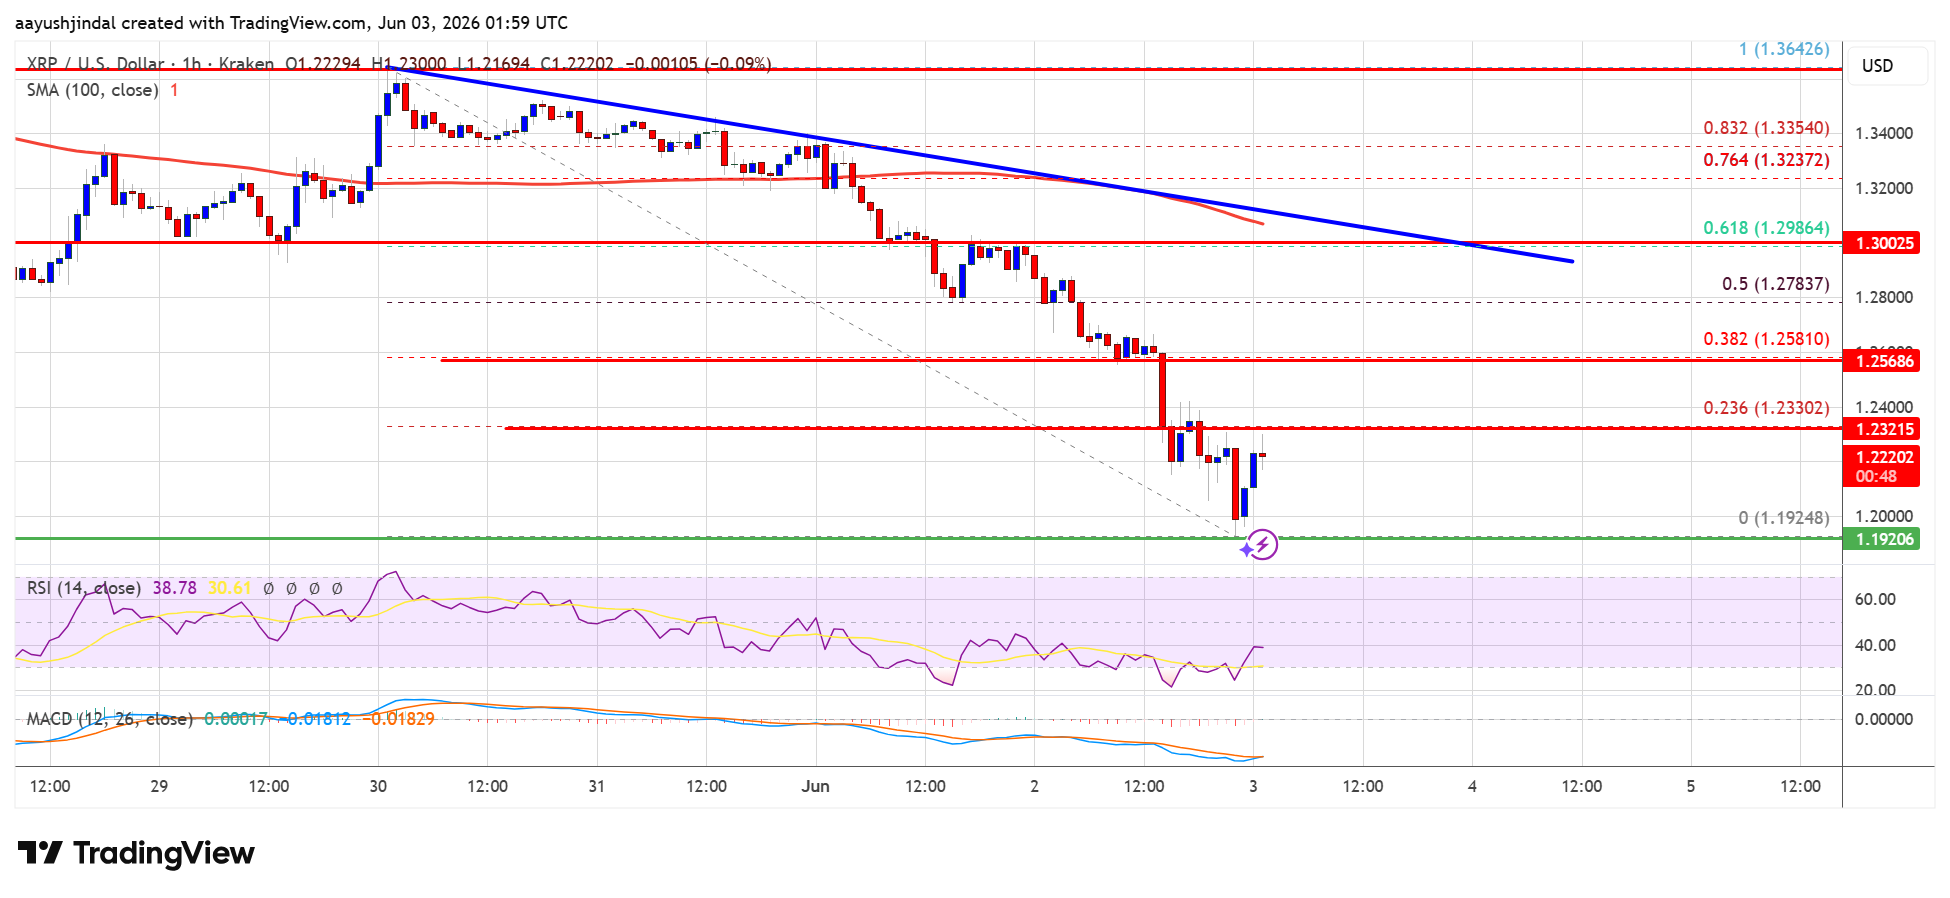
XRP price extended losses and traded below $1.220. The price is now consolidating losses and faces hurdles near $1.2350 and $1.250.
- XRP price started another decline and traded below the $1.250 zone.
- The price is now trading below $1.2350 and the 100-hourly Simple Moving Average.
- There is a bearish trend line forming with resistance at $1.2850 on the hourly chart of the XRP/USD pair (data source from Kraken).
- The pair could continue to move down if it stays below $1.250.
XRP Price Dips Below $1.250
XRP price failed to stay above $1.30 and extended its decline, like Bitcoin and Ethereum. The price declined below $1.2850 and $1.2650 to enter a short-term bearish zone.
The price even extended losses below $1.220. A low was formed at $1.1924, and the price is now consolidating losses well below the 23.6% Fib retracement level of the downward move from the $1.3640 swing high to the $1.1924 low.
The price is now trading below $1.2320 and the 100-hourly Simple Moving Average. If there is a fresh recovery move, the price might face resistance near the $1.2330 level. The first major resistance is near the $1.2580 level. The main resistance could be $1.2780 or the 50% Fib retracement level of the downward move from the $1.3640 swing high to the $1.1924 low.
A close above $1.2780 could send the price to $1.2850. The next hurdle sits at $1.2880. There is also a bearish trend line forming with resistance at $1.2850 on the hourly chart of the XRP/USD pair. A clear move above the $1.2880 resistance might send the price toward the $1.30 resistance. Any more gains might send the price toward the $1.3250 resistance.
More Losses?
If XRP fails to clear the $1.2580 resistance zone, it could start a fresh decline. Initial support on the downside is near the $1.2050 level. The next major support is near the $1.20 level.
If there is a downside break and a close below the $1.20 level, the price might continue to decline toward $1.1920. The next major support sits near the $1.1880 zone, below which the price could continue lower toward $1.1840.
Technical Indicators
Hourly MACD – The MACD for XRP/USD is now gaining pace in the bearish zone.
Hourly RSI (Relative Strength Index) – The RSI for XRP/USD is now below the 50 level.
Major Support Levels – $1.1920 and $1.1840.
Major Resistance Levels – $1.2350 and $1.2580.
Related Articles

Solana Just Made History, Could A Massive Recovery Be Next?
Solana has made history by posting an unprecedented streak of monthly losses, pl...
$12.6 Trillion Schwab Targets Mid-2027 Crypto Trading Rollout For Advisors
Charles Schwab is preparing to push deeper into crypto by targeting a 2027 rollo...
Bitcoin Crash Explained: Binance Research Blames Outflows Toward US Equities
The broader crypto market has endured one of its toughest weeks of the year, wit...
Crypto Treasury Flows Lose Steam, Marking Deepest Drop Since 2024
Bitcoin carried nearly all of May’s inflows. Monthly flows into crypto tre...