XRP Price Under Pressure—Can It Survive This Support Test?
Alex Smith
2 months ago

XRP price started a fresh decline below $2.10. The price is now struggling and faces resistance near the $2.050 pivot level.
- XRP price started a fresh decline below the $2.040 zone.
- The price is now trading below $2.020 and the 100-hourly Simple Moving Average.
- There is a bearish trend line forming with resistance at $2.050 on the hourly chart of the XRP/USD pair (data source from Kraken).
- The pair could continue to move down if it settles below $2.00.
XRP Price Dips Again
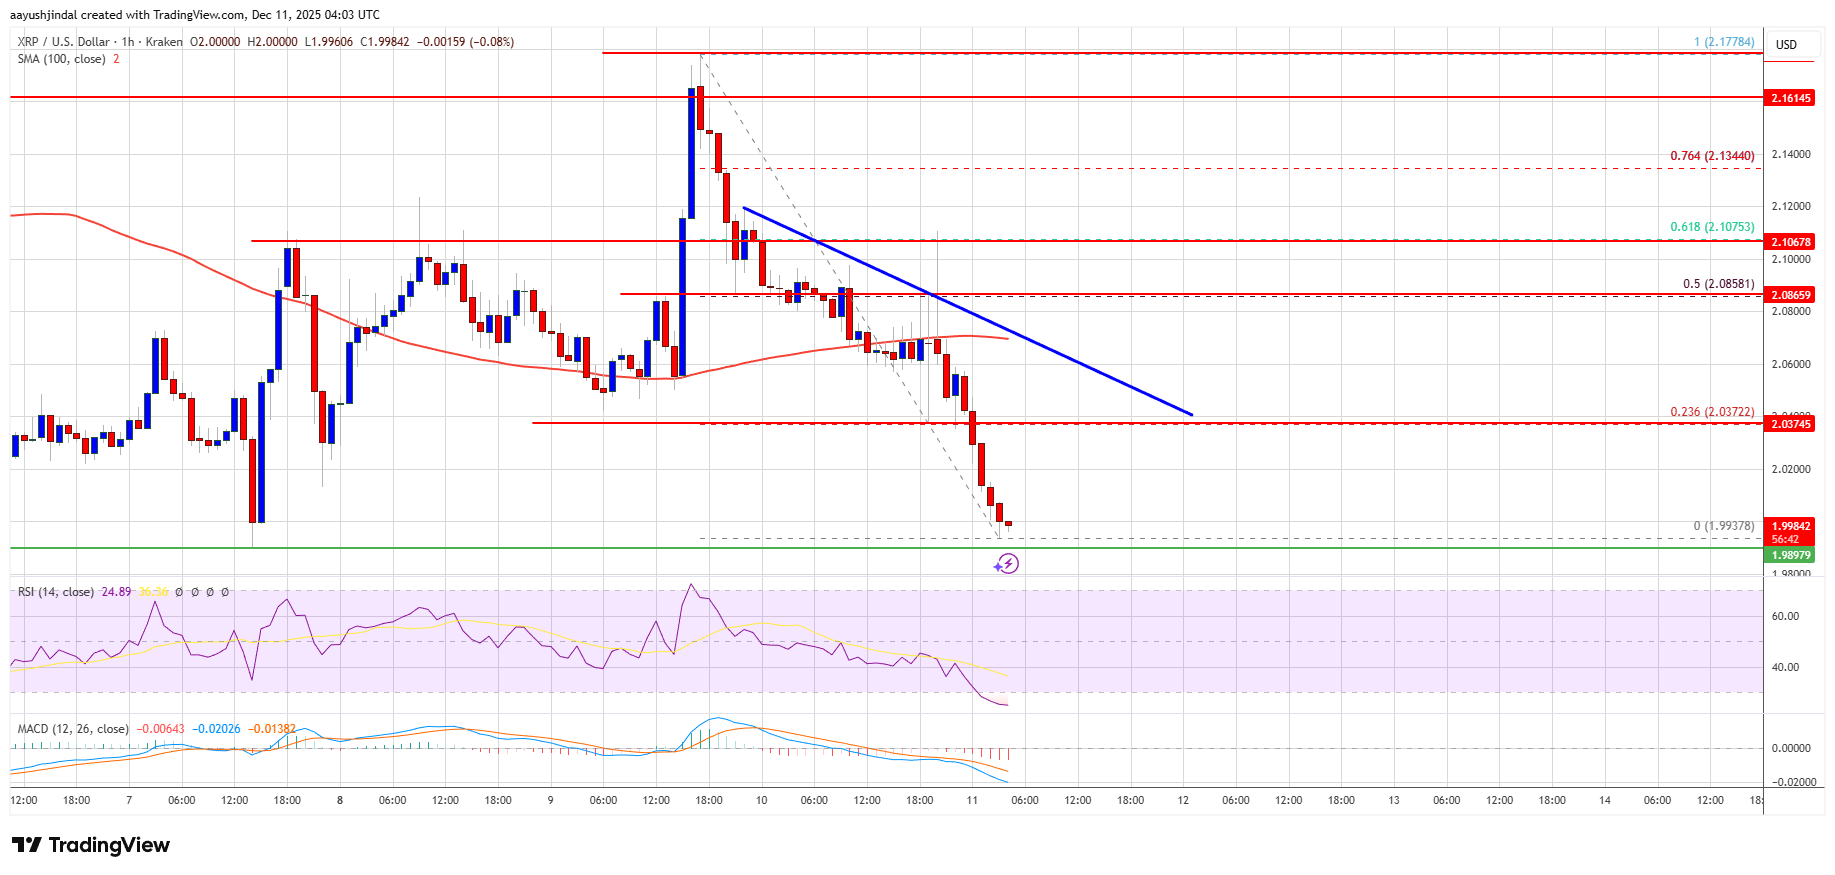
XRP price attempted a recovery wave above $2.120 but failed to continue higher, like Bitcoin and Ethereum. The price started a fresh decline below $2.10 and $2.050.
There was a move below the $2.00 support level. A low was formed at $1.993, and the price is now consolidating losses below the 23.6% Fib retracement level of the downward move from the $2.177 swing high to the $1.993 low.
The price is now trading below $2.050 and the 100-hourly Simple Moving Average. If there is a fresh upward move, the price might face resistance near the $2.0350 level. The first major resistance is near the $2.050 level. There is also a bearish trend line forming with resistance at $2.050 on the hourly chart of the XRP/USD pair.
A close above $2.050 could send the price to $2.085 and the 50% Fib retracement level of the downward move from the $2.177 swing high to the $1.993 low. The next hurdle sits at $2.10. A clear move above the $2.10 resistance might send the price toward the $2.150 resistance. Any more gains might send the price toward the $2.1850 resistance. The next major hurdle for the bulls might be near $2.220.
More Losses?
If XRP fails to clear the $2.050 resistance zone, it could start a fresh decline. Initial support on the downside is near the $2.00 level. The next major support is near the $1.9850 level.
If there is a downside break and a close below the $1.9850 level, the price might continue to decline toward $1.920. The next major support sits near the $1.880 zone, below which the price could continue lower toward $1.820.
Technical Indicators
Hourly MACD – The MACD for XRP/USD is now gaining pace in the bearish zone.
Hourly RSI (Relative Strength Index) – The RSI for XRP/USD is now below the 50 level.
Major Support Levels – $2.00 and $1.9850.
Major Resistance Levels – $2.050 and $2.10.
Related Articles

XRP ‘Looks Different’ This Cycle, Targets No. 2 Spot: Crypto Analyst
Crypto Insight UK director Will Taylor argued in a new video that XRP is “tradin...
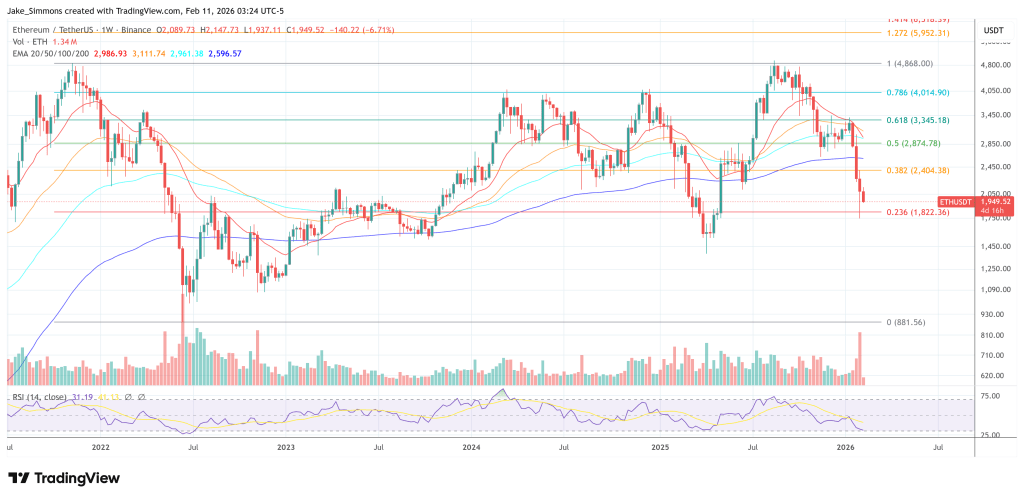
Ethereum ETF ‘Diamond Hands’ Face Their Harshest Test At $2,000
Ethereum ETF investors are sitting on a far uglier entry point than their bitcoi...
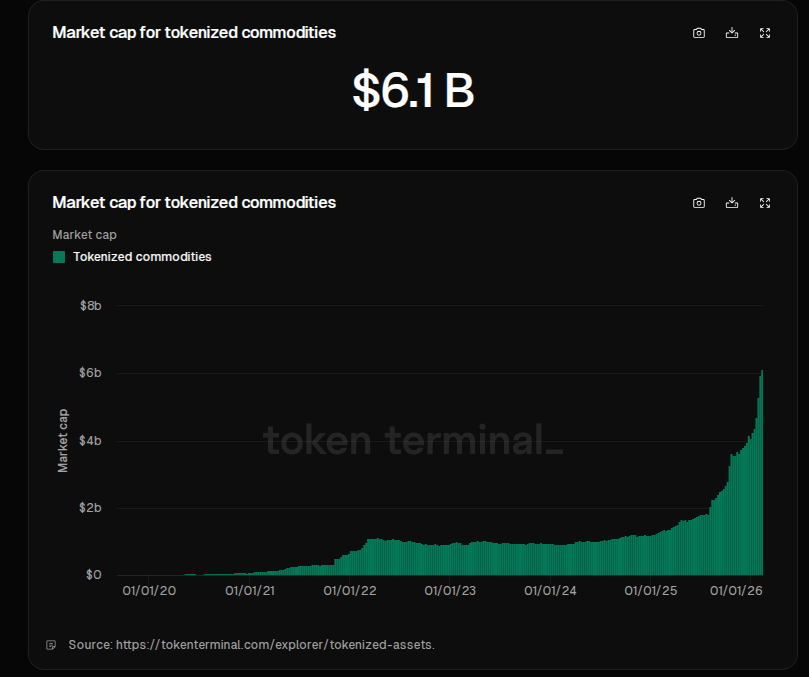
Blockchain Meets Gold: Tokenized Commodities Hit $6 Billion
Markets have put more gold on blockchains, And the shift has been rapid. Reports...

XRP Positioned For Major Structure Shift As Price Tests Critical Level
After recovering from last week’s lows, XRP has been moving sideways, hovering b...