Apollo Hospitals Enterprise Shares Form Ascending Triangle Pattern; Check RSI, MACD and More
Alex Smith
4 months ago

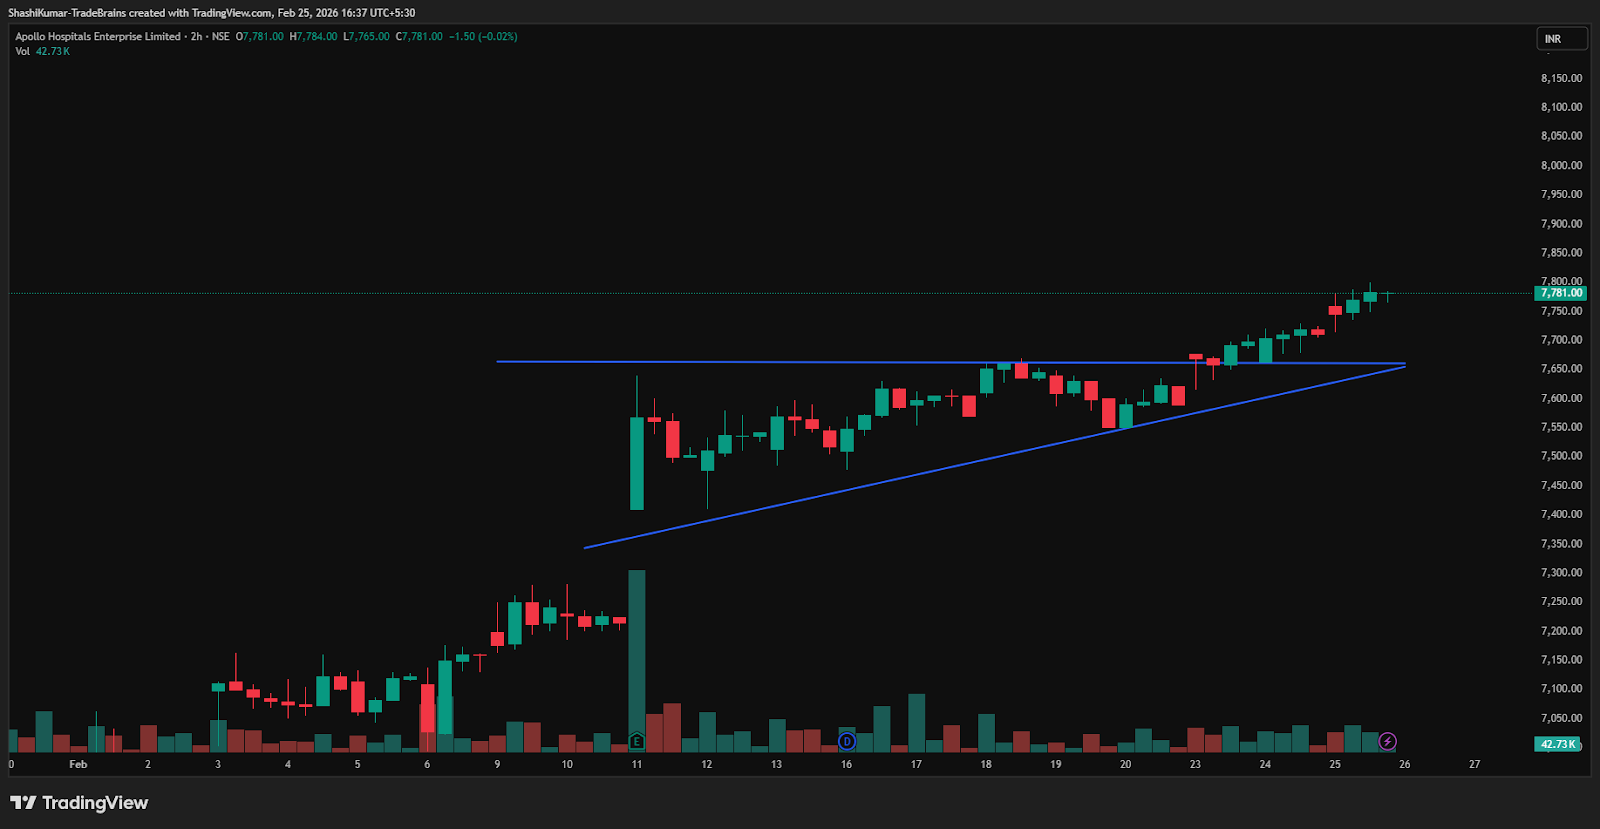
Synopsis: Apollo Hospitals Enterprise Ltd is showing an ascending triangle on the 2-hour chart, indicating a potential short-term bullish breakout.
An ascending triangle is a bullish continuation pattern characterised by higher lows and a flat resistance line, indicating rising buying pressure toward the resistance level.
The chart indicates a confirmed bullish breakout above horizontal resistance. Backed by strong volume, it reflects increasing buying pressure and suggests a potential short-term upward move.
On Wednesday, Apollo Hospitals Enterprise Ltd stayed above the ascending triangle’s 2-hour chart neckline and maintained levels above the Rs 7,663 level, boosting its bullish momentum.
In an ascending triangle, targets are set at the nearest resistance levels or by projecting the triangle’s height from the breakout, with traders confirming moves via strong volume and momentum.
Apollo Hospitals Enterprise Ltd Chart: 2-hour Timeframe
Indicator Confirmation
- RSI: The daily RSI rose from 73.9 in the previous trading session to 75.8 on Wednesday.
- MACD: On the daily time frame, the blue MACD line was above the orange signal line, with the histogram turning green, indicating bullish momentum.
- Moving Averages: On the daily time frame, the 5-day moving average was above the 9-day moving average, further confirming a bullish trend.
- Price Volume Trend: The Price Volume Indicator confirms the uptrend, accompanied by a sharp increase in buying volume in the daily time frame.
Implications
The ascending triangle pattern points to continued upside potential. Sustaining levels above the Rs 7,663 support mark, especially if accompanied by strong trading volumes, would further strengthen the near-term bullish outlook.
About the stock
Apollo Hospitals Enterprise Limited is India’s largest omni-channel healthcare platform. It operates a pan-India network of 76 hospitals with 10,325 capacity beds. Its ecosystem includes 7,113 pharmacy outlets, extensive diagnostic centres, and the Apollo 24/7 digital platform, which serves over 46 million registered users. The company provides comprehensive primary, secondary, and tertiary care.
Over the past month, Apollo Hospitals Enterprise Ltd has climbed 14.29%. However, despite this recent uptick, the stock remains 1.11% lower over the past six months, while delivering a 24.2% gain on a year-on-year basis. For more such technical stock ideas, click here to view our research page.
Disclaimer: The views and investment tips expressed by investment experts/broking houses/rating agencies on tradebrains.in are their own, and not that of the website or its management. Investing in equities poses a risk of financial losses. Investors must therefore exercise due caution while investing or trading in stocks. Trade Brains Technologies Private Limited or the author are not liable for any losses caused as a result of the decision based on this article. Please consult your investment advisor before investing.
The post Apollo Hospitals Enterprise Shares Form Ascending Triangle Pattern; Check RSI, MACD and More appeared first on Trade Brains.
Related Articles

From Real Estate to Power: How Data Centers Are Driving India’s Next Investment Cycle
Synopsis: Data centers have quietly become one of the more interesting stock mar...

Top 10 Stocks That Will Trade Ex -Dividend Next Week
Synopsis: 10 stocks that have announced dividends for their shareholders of up t...

Top 4 High-Growth SFB Stocks to Watch in 2026
Synopsis: India’s Small Finance Banks are quietly building one of the most...

5 Indian CDMO Stocks Benefiting from the Global Pharma Outsourcing Boom
Synopsis: Global pharmaceutical companies are rapidly diversifying their manufac...