Prediction Market Volume Holds at $5.25B as Kalshi Nears 50% Market Share
Alex Smith
4 months ago
Prediction markets appear to be consolidating, posting $5.25 billion across all tracked platforms for the week ending Feb. 22. The weekly volume was essentially flat against the $5.33 billion posted the prior week, and it marks the second consecutive week without a meaningful swing in either direction after the Super Bowl unwind.
But a top-line that barely moves can still tell a story, and the internals this week are more interesting than the surface suggests. Kalshi’s volume jumped 6.7% week-over-week, pushing its market share from 45.5% to 49.3% as Polymarket’s share stayed relatively flat at 34.6%. Opinion logged a third straight week of double-digit percentage declines. And on the user side, Polymarket’s active base dropped nearly 18% even as the platform’s transaction count climbed.
According to DeFi Rate’s prediction market tracker, Kalshi and Polymarket combined for $4.41 billion this week — up from $4.31 billion the week prior as the main prediction market duo reinforces its baseline without NFL or another major trading catalyst.
Platform breakdown: Week of Feb. 16-22
The full week-over-week comparison for the weeks ending Feb. 15 and Feb. 22 continue the trend of platforms outside of Kalshi and Polymarket showing more volatility from one week to the next. Meanwhile, Kalshi’s $2.59 billion and Polymarket’s $1.83 billion weekly trading volume fall within expected ranges.
PlatformFeb 9–15Feb 16–22WoW changeMkt share (2/16–22)Kalshi$2.43B$2.59B+6.7%49.3%Polymarket$1.88B$1.82B−3.2%34.6%Opinion$709.7M$603.8M−14.9%11.5%predict.fun$184.7M$220.3M+19.3%4.2%Other*$126.4M$12.6M—0.2%Overtime.io$3.9M$4.5M+14.4%0.1%Total$5.33B$5.25B−1.4%100%*”Other” on the Dune dashboard groups Limitless, Myriad, and ForecastEx for UX reasons, as noted by Dune. The prior week tracked Limitless ($109.4M) and Myriad ($17.0M) as separate line items. The sharp apparent decline in “Other” reflects this grouping change rather than a volume collapse at those platforms. Whether Limitless maintained its +58.7% gain from the prior week is not determinable from current data.
The week reinforced the two-tier structure of the market. Kalshi and Polymarket together accounted for 83.9% of all tracked volume, up from 80.8% the prior week. That concentration has ticked upward for three consecutive weeks, as Opinion contracts and the smaller platforms remain too small to meaningfully offset the shift.
Kalshi sustains trading volume post-Super Bowl
Kalshi’s $2.59 billion in weekly volume during the second week after the Super Bowl is not what you’d expect from a platform whose top volume driver just went dark. Kalshi was up 6.7% WoW, its second consecutive positive week, and crossed 49% market share for the first time in the current reporting period.
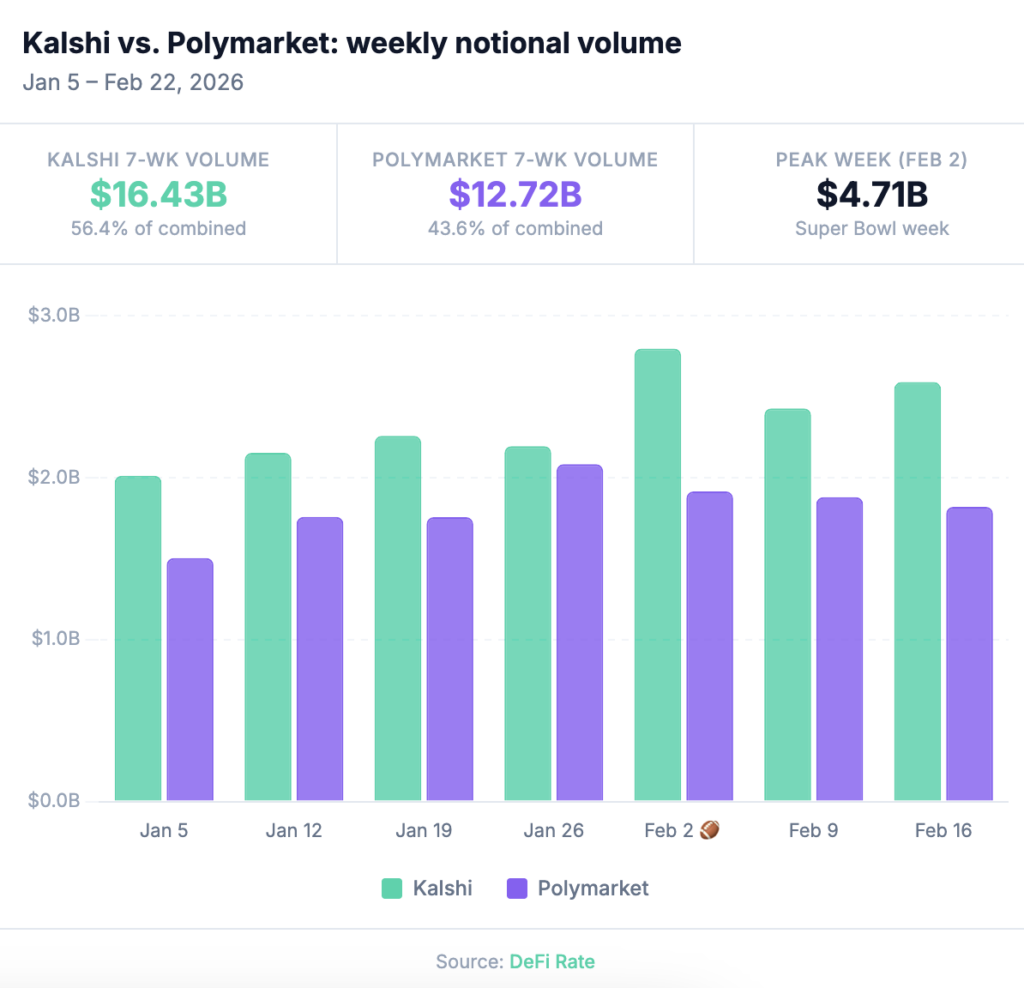
Looking at the past six weeks of notional volume data, Kalshi is settling in as consistent market leader with Polymarket a clear No. 2, with sports volume the main differentiator as we’ve already established.
The category breakdown explains what’s filling the post-NFL gap. Sports volume came in at $2.21 billion, up from $1.996 billion the prior week: a 10.9% increase without any football on the schedule. The main drivers include NBA, NCAAB and some Olympic events, notably the USA-Canada hockey final. The NBA regular season resumed Thursday after the All-Star break, with conference standings tightening as the playoff picture comes into focus, and college basketball markets deepening as Selection Sunday (March 15) moves into view.
Neither the NBA nor the NCAA tournament individually matches the Super Bowl as a single-event volume catalyst, but together they represent weeks of sustained, high-engagement trading rather than a one-day spike. Kalshi’s sports concentration deepened again this week, from 82.2% to 85.4% of total platform volume. The platform is not diversifying away from sports, though politics will likely grow in category share as we get closer to the midterms. Here are Kalshi’s top five volume markets for the trailing seven days, according to our tracking.
The non-sports categories, while growing in isolation, still pale in comparison to the sports engine. Crypto was the second-largest category at $206.4M (8.0% of platform volume), followed by politics at $55.0M (2.1%) and mentions at $25.6M (1.0%). Climate and weather showed up meaningfully at $22.4M, and entertainment dropped to $15.3M — down from $22.7M the prior week, continuing the post-Super Bowl normalization.
Interesting to note that Kalshi’s crypto category has now grown in each of the past two weeks (+22% last week, +8.3% this week). Economics and financials are present but thin. The non-sports diversification is real, but at 14.6% of total volume, it’s still a footnote to the sports story. Vitalik Buterin‘s concerns, which we covered last week, that prediction markets are over-converging toward sports and short-term crypto speculation at the expense of durable financial utility is not getting any less relevant as you watch these category splits week by week.
Polymarket: Resilient on volume as weekly users decline
Polymarket held up reasonably well this week on volume — down 3.2% to $1.82 billion — but the user number that came back from Dune is hard to ignore. Polymarket’s 254,730 weekly active users was down from 309,991 the prior week, representing a drop of nearly 18% in one week.
That’s a significant user pullback on a smaller volume dip. The data raises some questions: Polymarket processed 22.7 million transactions last week with 17.8% fewer users, meaning the remaining base traded more frequently and likely in larger average trade sizes. Whether that’s healthy consolidation around engaged power users or early-stage retail churn remains to be seen in the coming weeks.
Meanwhile, the category split continues to differentiate Polymarket from Kalshi in significant ways. Sports remained the top category at $721.2M (39.6% of platform volume), but crypto and politics together contributed another $940.6M, with Trump-specific markets tracked as a discrete category at $54.4M. Polymarket’s top three categories span genuinely different domains and different user motivations, which serves as a structural buffer when any single category cools.
A few category moves worth noting. Culture jumped to $46.0M, nearly doubling from last week’s $25.3M. Economy showed up as a discrete category at $24.2M as earnings trading fell sharply to $391K from last week’s $5.4M. The cross-platform convergence on the March Fed decision is also worth flagging: both Kalshi (96%) and Polymarket (96%) are pricing no rate cut at the March meeting, a near-identical read on a macro event across independently operated markets, consistent with CME FedWatch pricing above 97% hold probability. It’s a clear illustration of what the Fed study we covered last week was pointing at.
The more notable Polymarket news this week didn’t come from the volume data. The platform launched a public API and permissionless liquidity infrastructure, a structural shift DeFi Rate covered separately. The long-term read on that move: Polymarket US is building toward a market-maker ecosystem and programmatic trading that could change who generates volume on the platform and how. The user count may matter less if institutional and API-driven flow scales.
Kalshi vs. Polymarket: The split deepens
The sports vs. non-sports divide between these two platforms has been a recurring theme in our weekly coverage, and this week sharpened it further.
SegmentKalshiPolymarketTotalSports$2.21B (85.4% of Kalshi)$721.2M (39.6% of Poly)$2.93BNon-sports$377.6M (14.6%)$1.10B (60.4%)$1.48BIn sports markets, Kalshi’s 3:1 lead from last week widened slightly. In non-sports, Polymarket’s lead held near the same ratio. Two platforms at roughly similar overall scale continue to serve fundamentally different but overlapping market functions.
The divergence is intentional on both sides. Kalshi’s Giannis partnership and Robinhood distribution infrastructure are explicitly sports-facing. Polymarket’s API buildout and deep crypto/politics liquidity are explicitly not. The question that will define the next six months isn’t which model wins as both are clearly working, but which model is better insulated when the sports calendar thins out.
Opinion’s decline continues
Opinion logged a third straight week of meaningful volume decline coming in at $603.8M, down 14.9% from $709.7M. The platform has now shed 63.6% of its volume since its Jan. 19 peak of $1.95 billion across four consecutive down weeks.
We published a deep dive on Opinion’s data this week, and the new weekly data reinforces that analysis. The platform’s user count fell to 12,739, down 29.6% from 18,098 the prior week. Its per-user volume figure climbed again: at $603.8M across 12,739 users, that’s roughly $47,400 per user per week, up from ~$39,200 the week before. The user base is contracting faster than the volume, which means the remaining traders are becoming even more concentrated.
The transaction count offers further context. Opinion processed 227,847 transactions this week, generating $603.8M in volume, an implied average trade size of approximately $2,650 per transaction. Polymarket’s 22.7 million transactions generated $1.82 billion, for an average of roughly $80 per transaction. The gap, now approximately 33:1, has not narrowed meaningfully through Opinion’s growth or its subsequent decline. And it continues to point to inflated, artificial trading volumes as we noted in our separate Opinion platform analysis.
Opinion remains the third-largest exchange in tracked volume by a wide margin. It has real infrastructure, credible backers in Hack VC and Jump Crypto, and market categories that fill genuine gaps for non-US traders outside the Kalshi/Polymarket duopoly. But the structural questions documented in our deep dive haven’t resolved themselves. Until the platform’s volume-to-transaction ratio converges toward industry norms, or an independent analysis of BNB Chain activity addresses the wash trading question, Opinion’s headline figures warrant the same careful reading they always have.
Transactions and users: The full picture
The transaction count divergence between Polymarket and Opinion this week is stark. Polymarket processed 22.7 million transactions — 100x more than Opinion’s 227,847 — while generating roughly 3x the volume.
Kalshi’s 17.6 million transactions were nearly neck and neck with Polymarket’s, reflecting the platform’s high-frequency sports trading infrastructure. Together, Kalshi and Polymarket accounted for 98.2% of all tracked transactions this week.
The 20.3% drop in total tracked users (excluding Kalshi), from 362,704 to 289,144 is the week’s most notable macro signal on the demand side. Whether this is post-Super Bowl seasonality running through the system or something more structural will be clearer in the coming weeks. Retail user attrition after peak event cycles is a known pattern in sports betting; the question for prediction markets is how deep the drop-off goes before the next catalyst, which is coming up in March.
What comes next?
The sports calendar is about to get busy again. The NBA resumed Thursday after the All-Star break, and Selection Sunday is March 15 — just three weeks out. Once the bracket drops, March Madness becomes Kalshi’s biggest volume event outside the NFL season (at least until major elections). Last year’s Robinhood partnership drove over $200 million in tournament volume. With a broader distribution footprint and a year of platform maturity, that ceiling is much higher now. The next four weeks are the real test of whether Kalshi’s post-Super Bowl floor holds: if the $2.4–2.6B weekly run rate sustains through mid-March, it suggests the retail base is genuinely sticky and not purely event-driven.
For Polymarket, the API launch and permissionless liquidity infrastructure matter more than any single week’s numbers. If programmatic trading and market-maker participation scale, volume generation may decouple from user count in ways the weekly active user metric doesn’t yet capture.
Opinion’s trajectory remains an open question. Three consecutive weeks of double-digit decline following four weeks of prior losses is a sustained contraction from the January peak. Whether it stabilizes, continues toward the $400–500M range, or reverses depends largely on the $OPN token timeline and what that does to points farming incentives — neither of which is visible in the current data.
The macro picture hasn’t changed: an industry that grew 13x in six months doesn’t need to panic over a few flat weeks. But as the Super Bowl cycle fully clears, the next month will tell us what this market actually looks like without the NFL underneath it.
Data sourced from DeFi Rate’s prediction market tracker and Dune Data Dashboards. Weekly data reflects the calendar week of Feb. 16-22 unless otherwise noted. Note: For UX reasons, projects including Limitless, Myriad, and ForecastEx are grouped together under “Other” on the Dune dashboard.
The post Prediction Market Volume Holds at $5.25B as Kalshi Nears 50% Market Share appeared first on DeFi Rate.
Related Articles
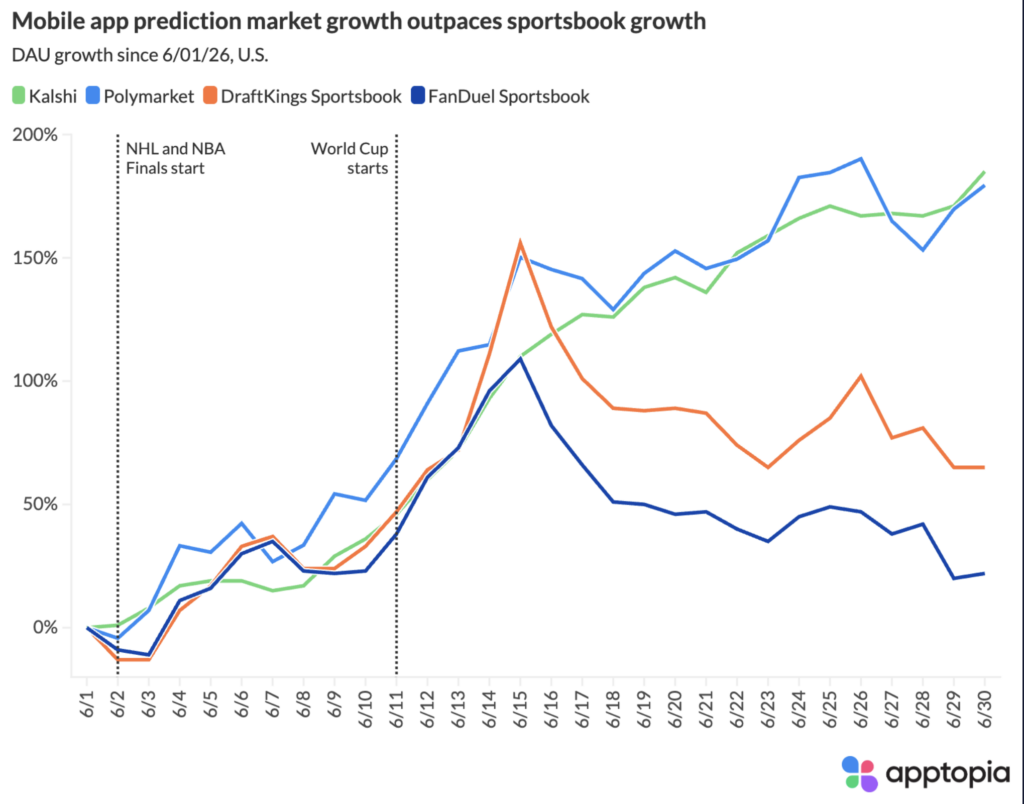
Kalshi Hits $1B on Winner Market as Prediction Sites Continue to Gain Daily Active Users During World Cup
Apptopia data shows prediction market apps continued adding users later in the W...
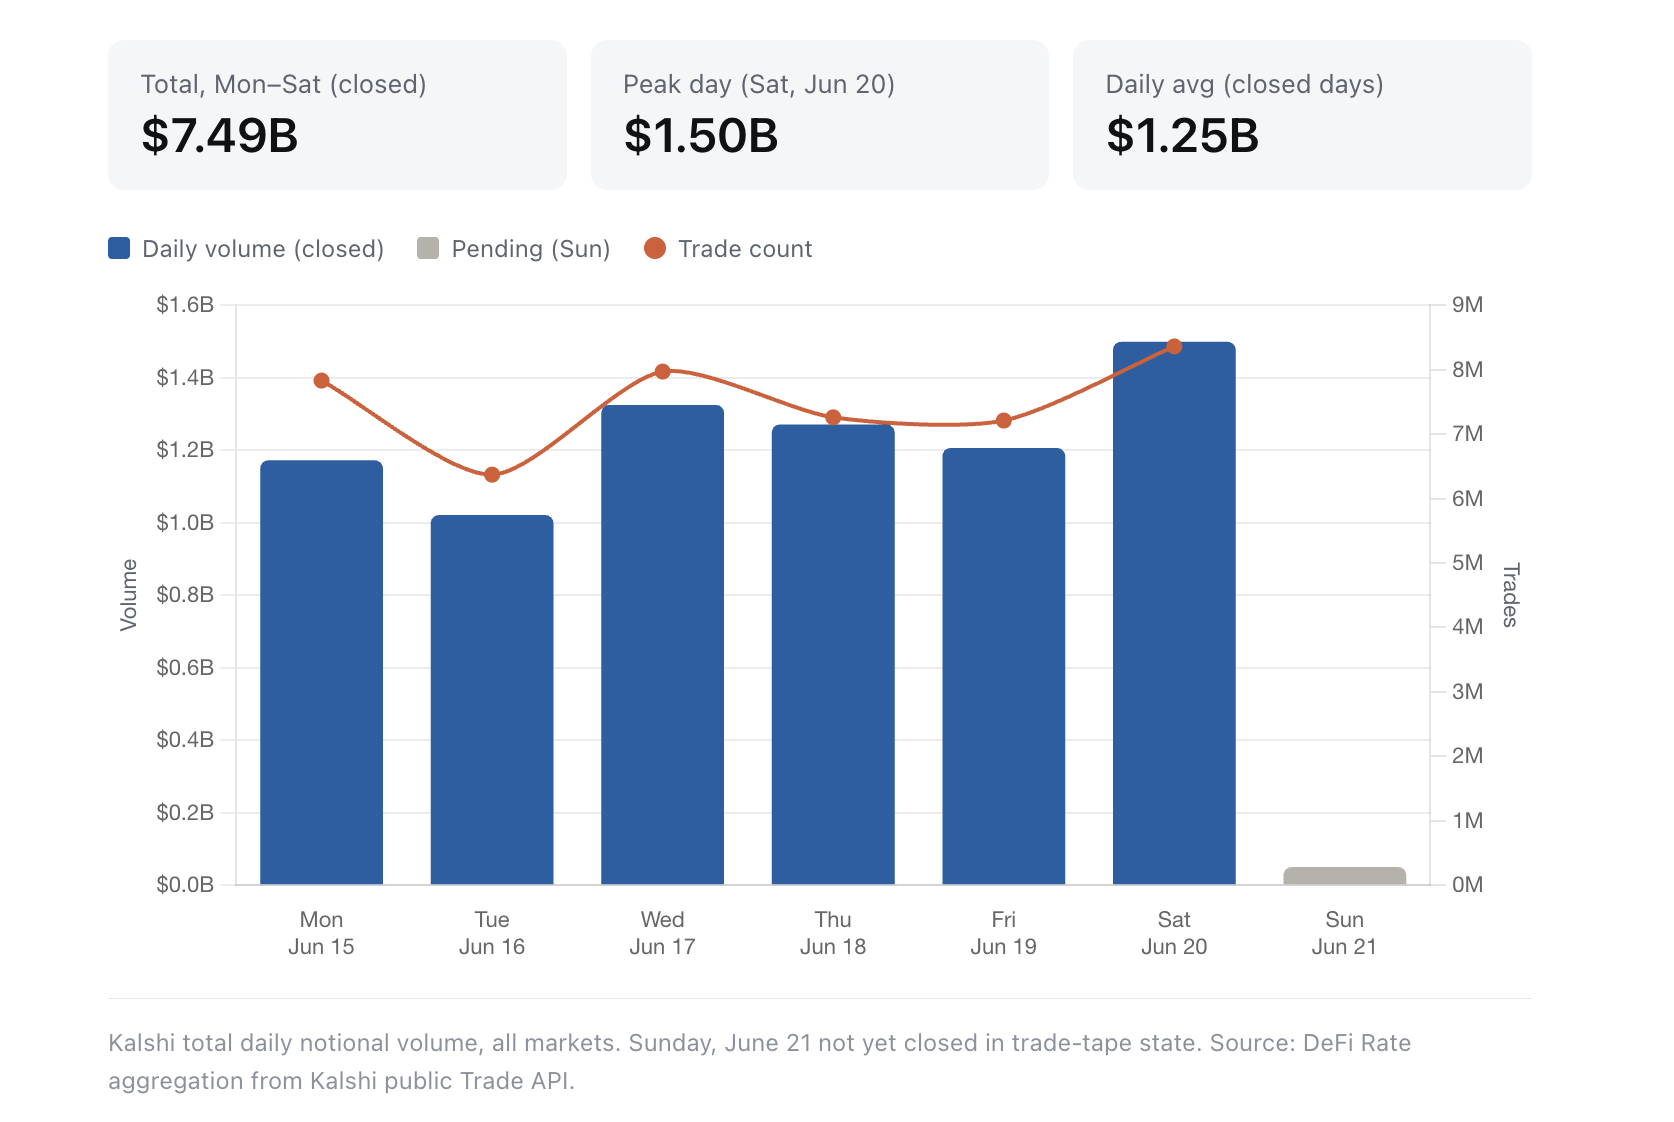
Kalshi Tops $7.5B With a Day Left, Smashing Its Own Weekly Volume Record
Kalshi has already surpassed $7.49 billion in notional volume for the week of Ju...

Referrals Are Live: Refer & Earn on Synthetix
Referrals on Synthetix are now live.Create & share your referral code and ea...
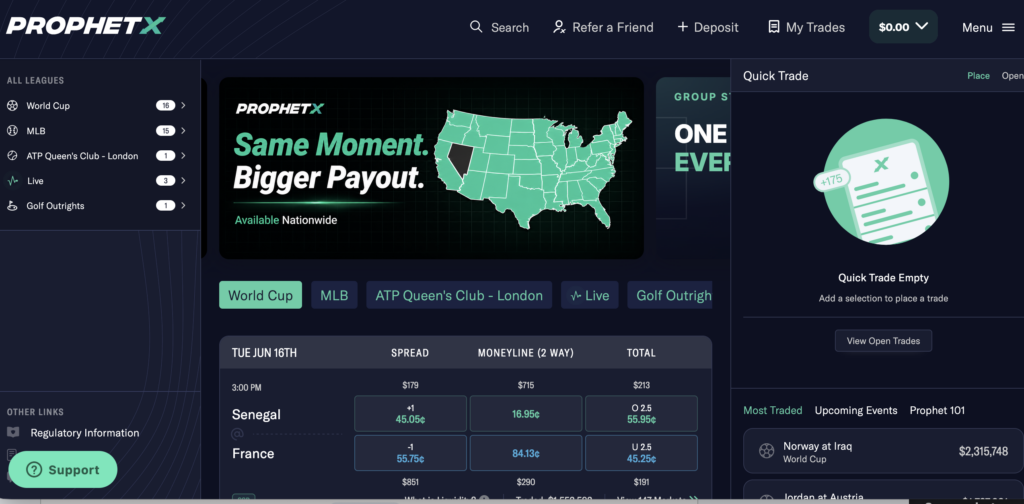
Novig Receives CFTC Approval as ProphetX Launches Sports Prediction Markets Days After Designation
Novig targets a summer rollout after earning CFTC designation, while ProphetX we...