Solana (SOL) Momentum Explodes as $100 Barrier Comes Into Focus
Alex Smith
3 months ago
Solana started a fresh increase above the $92 zone. SOL price is now consolidating near $95 and might aim for more gains above the $98 zone.
- SOL price started a fresh upward move above the $92 and $95 levels against the US Dollar.
- The price is now trading above $92 and the 100-hourly simple moving average.
- There is a bullish trend line forming with support at $94 on the hourly chart of the SOL/USD pair (data source from Kraken).
- The pair could extend gains if it clears the $98 resistance zone.
Solana Price Rallies Over 5%
Solana price started a decent increase after it settled above the $88 zone, like Bitcoin and Ethereum. SOL climbed above the $92 level to enter a short-term positive zone.
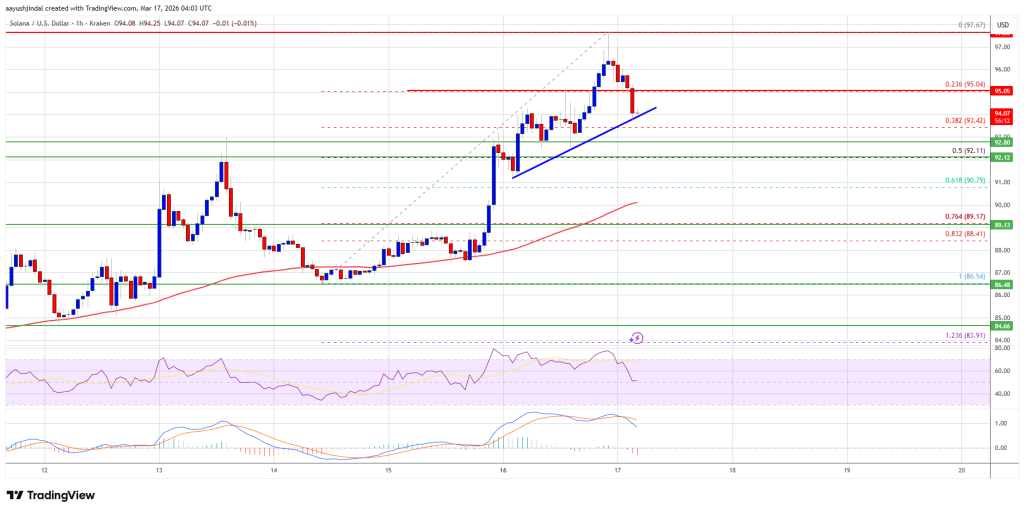
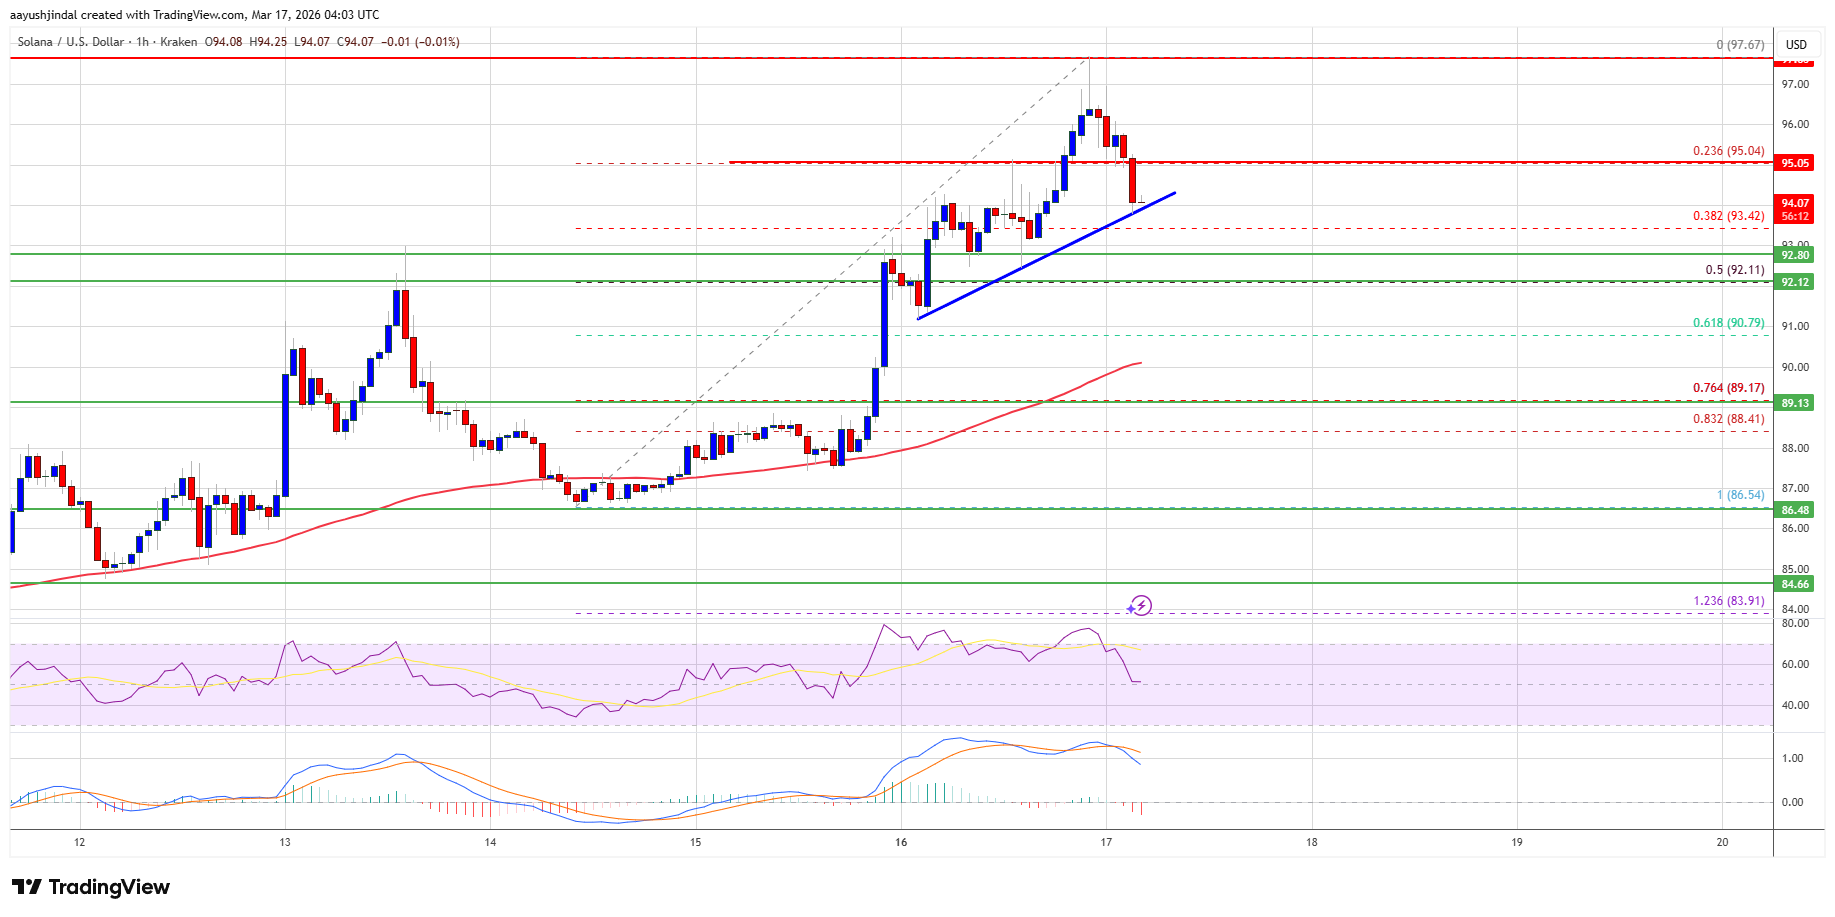
The price even smashed the $95 resistance. A high was formed at $97.67, and the price is now consolidating gains. There was a minor decline below the 23.6% Fib retracement level of the recent upward move from the $86.54 swing low to the $97.67 high.
Solana is now trading above $92 and the 100-hourly simple moving average. Besides, there is a bullish trend line forming with support at $94 on the hourly chart of the SOL/USD pair.
On the upside, the price is facing resistance near $95. The next major resistance is near the $98 level. The main resistance could be $100. A successful close above the $100 resistance zone could set the pace for another steady increase. The next key resistance is $105. Any more gains might send the price toward the $112 level.
Downside Correction In SOL?
If SOL fails to rise above the $98 resistance, it could start another decline. Initial support on the downside is near the $94 zone. The first major support is near the $92 level and the 50% Fib retracement level of the recent upward move from the $86.54 swing low to the $97.67 high.
A break below the $92 level might send the price toward the $88 support zone. If there is a close below the $88 support, the price could decline toward the $82 support in the near term.
Technical Indicators
Hourly MACD – The MACD for SOL/USD is losing pace in the bullish zone.
Hourly Hours RSI (Relative Strength Index) – The RSI for SOL/USD is above the 50 level.
Major Support Levels – $94.00 and $92.00
Major Resistance Levels – $95.00 and $98.00.
Related Articles

Zcash Fixes Critical Orchard Vulnerability As ZEC Holds $600 Support
Zcash has patched a dangerous vulnerability in its privacy-focused infrastructur...

Bitcoin Falls Below $66K As Short-Term Holder Stress Reaches February Levels
Bitcoin has lost the $66,000 level as selling pressure and uncertainty intensify...

XRP Already Powers Real Banking Activity, Says Evernorth, With More Growth Expected
Evernorth says daily activity on the XRP Ledger has climbed to nearly 3 million...
Crypto Is A ‘Failed’ Asset Class, Says Renowned Economist
Economist and macro trader Alex Krüger has argued that “crypto” has largely fail...