Bitcoin Hits Year-To-Date Low Amid Heavy Outflows, Signs Of Spot Buying Emerge
Alex Smith
3 hours ago
Bitcoin slid to a year-to-date low of $74,500 on Monday, a move that wiped roughly 38% off its peak. Markets reacted sharply, and traders felt the pinch as flows out of big funds accelerated.
Fund Flows And Market Mood
According to reports, global crypto exchange-traded products saw heavy withdrawals last week. Big US spot ETFs led the selling, and that pushed overall fund flows into deep negative territory.
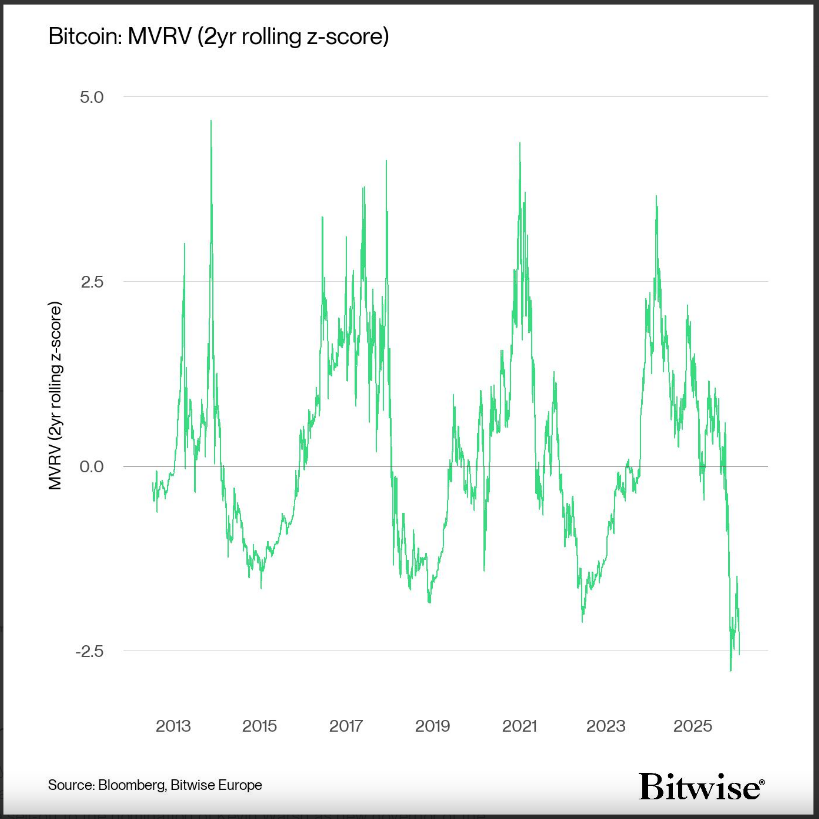
Based on Bitwise’s Weekly Crypto Market Compass report, Bitcoin’s recent drop pushed its two-year rolling MVRV z-score to a record low, a level tied to undervaluation and suggesting fire-sale conditions for the asset.
Sentiment gauges fell hard. Reports note that a two-year rolling MVRV z-score — a measure comparing market price to the average cost basis of holders, adjusted for volatility — hit its lowest reading ever. That kind of number points to widespread selling and prices that many investors now view as distressed.
Buying Interest On The Spot Market
On shorter time frames, signs of buying have appeared. The daily RSI plunged into the low 20s. This is a level that has often been followed by quick rebounds.
Spot volume data on major venues such as Binance and Coinbase showed net aggressive buying as Bitcoin bounced back toward about $79,420.
Open interest did not spike. Funding rates stayed negative. In plain terms: people were buying on the spot market rather than piling into leveraged long bets, which reduces the chance of a cascade of forced liquidations that can make moves messier.
Capitulation And LiquidationsReports say long positions were crushed last week, with close to 2 billion in BTC long liquidations recorded across derivatives markets. That pain can clear the field for fresh entrants.
At the same time, there are multiple billions of dollars of short positions clustered near higher price levels, around $85,000, that could be hit if Bitcoin climbs. Short-covering could add fuel to a bounce. Market structure now offers a mix of strong selling behind prices and real buying in front of them.
Where Support Might HoldBased on reports, buying interest combined with very low valuation metrics could create an asymmetric trade. That means the potential upside may be larger than the near-term downside, at least for traders willing to accept volatility.
Historically, dips into the RSI zone seen last week have led to roughly 10% rebounds most of the time since August 2023, although outcomes vary and nothing is guaranteed.
A Quiet But Real ConclusionInstitutional flows remain cautious. Major products such as the Grayscale Bitcoin Trust and the iShares Bitcoin Trust posted sizable outflows, signaling that some big holders stepped back.
Yet, on-chain and spot-volume signals hint that bargain hunting has started. The near-term path will probably be bumpy. Traders who want exposure will need to weigh the low valuation readings and pockets of buying against the very real possibility of further weakness if sentiment deteriorates again.
Featured image from Vecteezy, chart from TradingView
Related Articles

Solana Returns To A Critical Demand Zone — Trend Reload Or Breakdown Risk?
Solana has pulled back into a key demand zone, a level that could determine whet...

Here’s What To Expect If The Bitcoin Price Maintains Support Above $74,400
Crypto analyst and Elliott Wave expert Gert van Lagen has highlighted a critical...

Bitcoin’s Network Growth Just Reached Extreme Levels Last Seen Before The 2021 Surge
Bitcoin’s on-chain fundamentals are flashing a powerful signal that hasn’t appea...
Bitcoin Price Crashes Below $73,000, Hitting Lowest Level Since 2024
The market’s leading cryptocurrency, Bitcoin (BTC), slid to its lowest price lev...