Mphasis Ltd Forms a Descending Triangle Pattern With a Potential Bullish Upside
Alex Smith
3 hours ago

Synopsis: Mphasis Ltd has formed a descending triangle on the 4-hour chart, signalling a possible short-term bullish breakout.
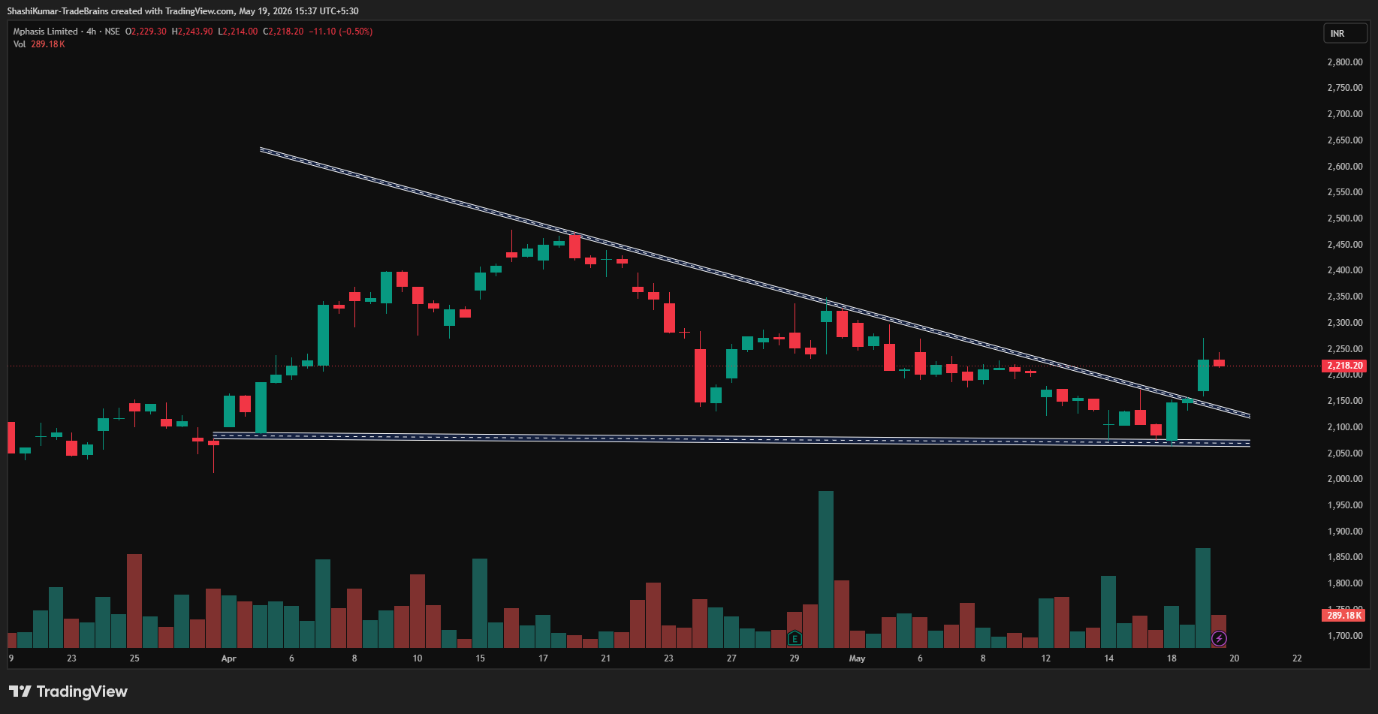
A descending triangle pattern is marked by lower highs and a flat support line, and a breakout above the resistance trendline may indicate strengthening buying momentum and a potential upward move. The chart shows a confirmed bullish breakout above the resistance neckline. Supported by volume surge and points to a potential short-term upward move.
Mphasis Limited broke above the key resistance level of Rs 2,166 on Tuesday and managed to stay above it, turning the level into a strong support zone. The stock closed at Rs 2,218.2 on the 4-hour chart, indicating continued bullish momentum.
In a descending triangle pattern, traders typically look for a breakout above the resistance trendline and project a price target based on the triangle’s height from the breakout point, while strong volume and momentum help confirm the bullish move.
Mphasis Limited Chart: 4-hour Timeframe
Indicator Confirmation
- RSI: The daily RSI indicates buying pressure, as it rose from 42.37 in the previous trading session to 49.95 on Tuesday.
- Price Volume Trend: The Price Volume Indicator confirms the uptrend, accompanied by an increase in buying volume in the daily time frame.
Implications
The descending triangle breakout suggests strengthening upside momentum. Sustaining above the Rs 2,166 support level, supported by strong trading volumes, could further strengthen the near-term bullish outlook.
About the stock
Mphasis Limited is a leading Indian IT services and consulting company headquartered in Bengaluru, Karnataka. The company specialises in cloud computing, artificial intelligence, digital transformation, and outsourcing services for industries such as banking, insurance, logistics, and telecom.
With a strong global presence and advanced technology solutions, Mphasis helps businesses modernise their operations and improve customer experience through innovation and AI-driven services. Over the past month, Mphasis Ltd has decreased by 8.23%. The stock has declined 18.26% over the past six months and declined 12.48% year-over-year. For more such technical stock ideas, clickhereto view our research page.
Disclaimer: The views and investment tips expressed by investment experts/broking houses/rating agencies on tradebrains.in are their own, and not that of the website or its management. Investing in equities poses a risk of financial losses. Investors must therefore exercise due caution while investing or trading in stocks. Trade Brains Technologies Private Limited or the author are not liable for any losses caused as a result of the decision based on this article. Please consult your investment advisor before investing.
The post Mphasis Ltd Forms a Descending Triangle Pattern With a Potential Bullish Upside appeared first on Trade Brains.
Related Articles

Abha Power & Steel Gains 2% After Bagging ₹4.92 Cr Railway Order
Synopsis: Abha Power & Steel Limited has secured a new railway sector order...

Siemens Energy T&D Share: Will Data Centres and Grid Expansion Fuel Demand Further?
Synopsis: Siemens Energy India Limited remains in focus after Nomura maintained...

HEC Infra Projects bags ₹11.48 Cr Power Grid Order For Substation Capacity Augmentation Works
Synopsis: HEC Infra Projects Limited has secured a Rs. 11.48 crore order from Po...

Stock to Buy: Fundamentally Strong Stock With an Upside Potential of 22%
Synopsis: Morgan Stanley remains bullish on Bajaj Finance, citing strong loan de...