Power Generation Stock Hints at Ascending Triangle Breakout Signals Extended Upside
Alex Smith
2 hours ago

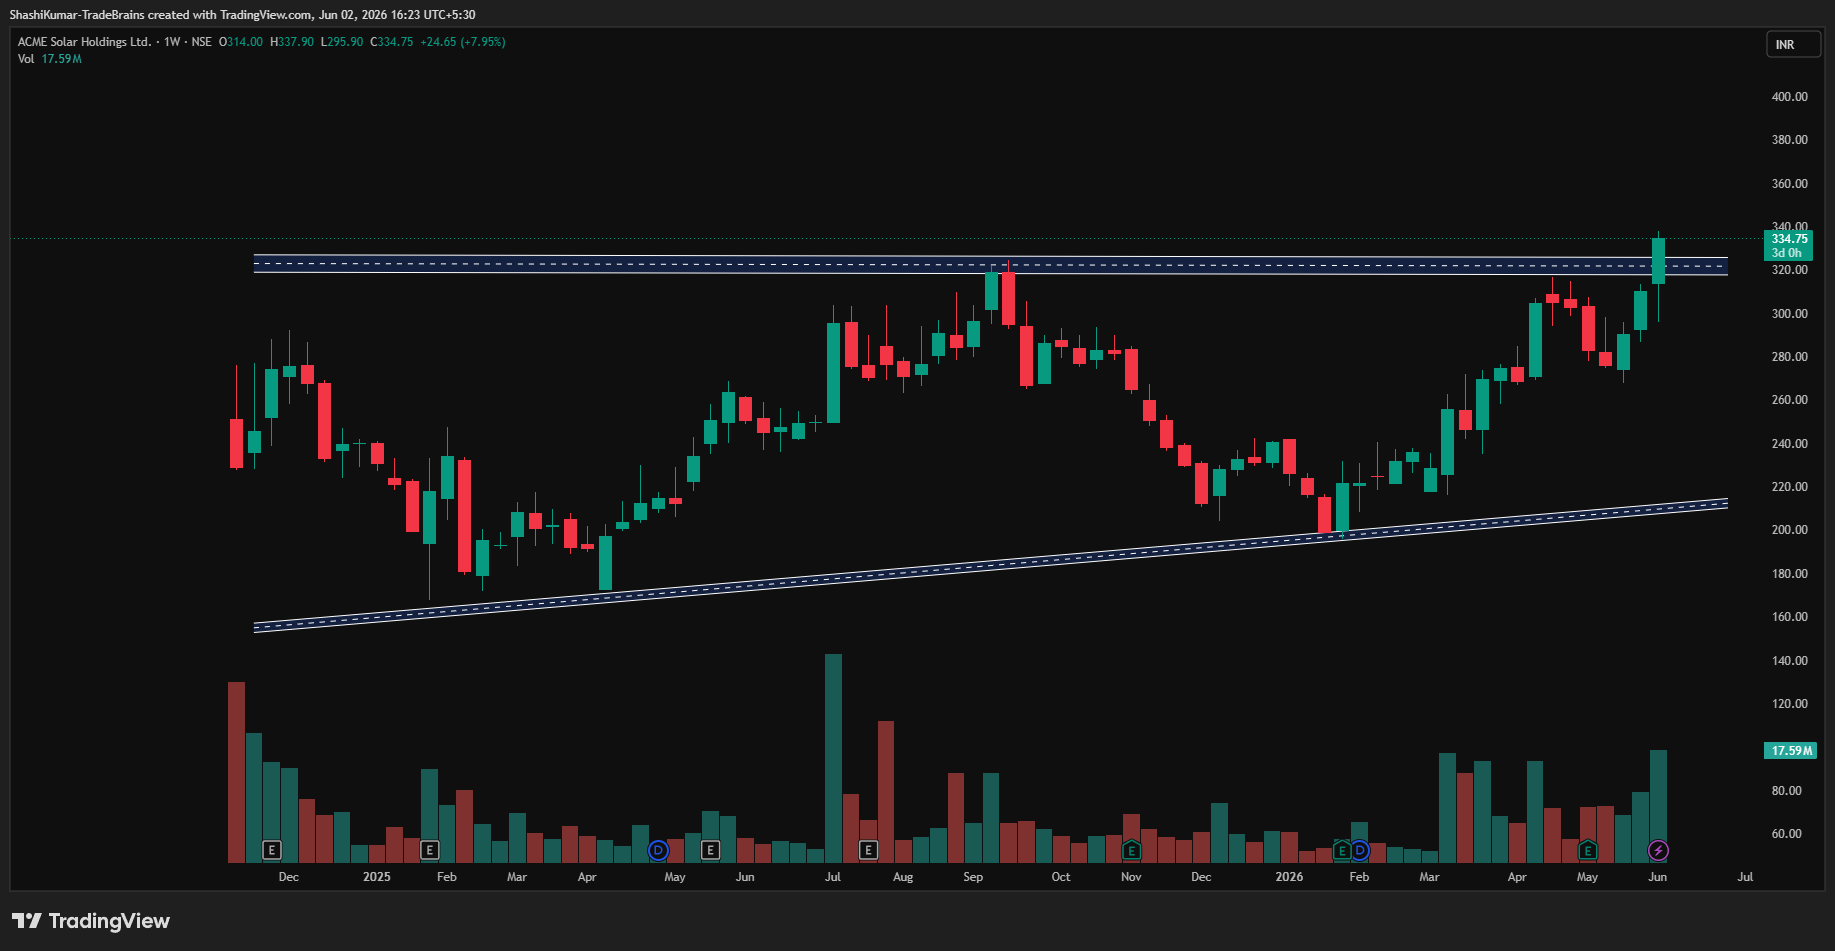
Synopsis: ACME Solar Holdings Ltdhas formed an ascending triangle on the 1-week chart.
A flat resistance line and higher lows characterise an ascending triangle, a bullish continuation pattern. The chart shows a bullish breakout above the key resistance zone near Rs 324, supported by strong buying momentum and rising volumes.
On Tuesday, ACME Solar Holdings Ltd broke above the key resistance level of Rs 324 and held there, transforming it into a strong support zone. On the weekly chart, the stock closed at Rs 334.75, indicating that bullish momentum has continued and buying interest has strengthened.
ACME Solar Holdings Ltd Chart: 1-week Timeframe
In an ascending triangle pattern, traders typically target the next resistance level or project a price move equal to the triangle’s height from the breakout point, while strong buying volume and positive momentum help confirm the bullish breakout.
Indicator Confirmation
RSI: The weekly RSI indicates buying pressure, as it rose from 63.65 in the previous week’s trading session to 68.5 on Tuesday.
Price Volume Trend: The Price Volume Indicator confirms the uptrend, accompanied by an increase in buying volume in the weekly time frame.
MACD: On the weekly time frame, the blue MACD line was above the orange signal line, with the histogram turning green, indicating bullish momentum.
Moving Averages: On the weekly time frame, the 5-day EMA was above the 9-day EMA, further confirming a bullish trend.
Implications
The ascending triangle pattern points toward continued upside potential. So long as the stock sustains above the newly established Rs 324 support level on strong volume, the near-term bullish outlook remains firmly intact.
About the stock
ACME Solar Holdings Limited is a top 10 Indian renewable energy IPP with a diversified portfolio spanning solar, wind, storage, and hybrid projects. The company boasts 2,990 MW operational and 5,081 MW under-construction capacity, complemented by significant BESS installations. It generates stable cash flows through long-term government PPAs and utilises in-house EPC and O&M capabilities for full project control.
ACME Solar Holdings Ltd continues its strong upward trajectory, posting a 12.13% gain this month. The stock’s impressive run includes a 50.85% surge over the last six months and a strong 29.87% return year-over-year. For more such technical stock ideas, click here to view our research page.
Disclaimer: The views and investment tips expressed by investment experts/broking houses/rating agencies on tradebrains.in are their own, and not that of the website or its management. Investing in equities poses a risk of financial losses. Investors must therefore exercise due caution while investing or trading in stocks. Trade Brains Technologies Private Limited or the author are not liable for any losses caused as a result of the decision based on this article. Please consult your investment advisor before investing.
The post Power Generation Stock Hints at Ascending Triangle Breakout Signals Extended Upside appeared first on Trade Brains.
Related Articles

Mrs Bectors: Can New Product Launches and Outlet Expansion Fuel the FMCG’s Next Growth Phase?
Synopsis: Mrs Bectors Food Specialities received a Buy rating from Anand Rathi w...

Ratnaveer Precision Share: Can Its CCL Entry Benefit From India’s Semiconductor and PCB Boom?
Synopsis: Ratnaveer Precision Engineering is entering the copper clad laminate (...

Stock to Buy: Pharma Stock With 31% Upside Potential
Synopsis: Natco Pharma has gained attention after Investec reiterated a Buy rati...

Havells India Forms Bullish Engulfing Pattern; Check Support and Resistance Levels
Synopsis: Havells India Ltd formed a bullish engulfing pattern on the 4-hour cha...