Trent Ltd Forms a Flag And Pole Pattern Pattern Indicating a Near-Term Bullish Breakout
Alex Smith
1 hour ago

Synopsis: Trent Limited has developed a flag and pole pattern on its 4-hour chart, indicating a potential near-term bullish movement.
This flag and pole pattern suggests a temporary consolidation after a strong upward move, with buying momentum gradually strengthening and indicating a potential bullish breakout continuation. The chart shows a bullish flag-and-pole pattern breakout, as the price moved above the resistance trendline.
Trent Limited broke above the key resistance line on the 4-hour chart on Friday and closed at Rs 4,303. The previous resistance level of Rs 4,205 is now acting as a strong support zone. Continued buying interest and rising volumes could support further upside momentum in the stock.
In a Flag and Pole pattern, traders typically target the next resistance level or project a price move equal to the flagpole’s height from the breakout point, while strong buying volume and bullish momentum help confirm the trend continuation.
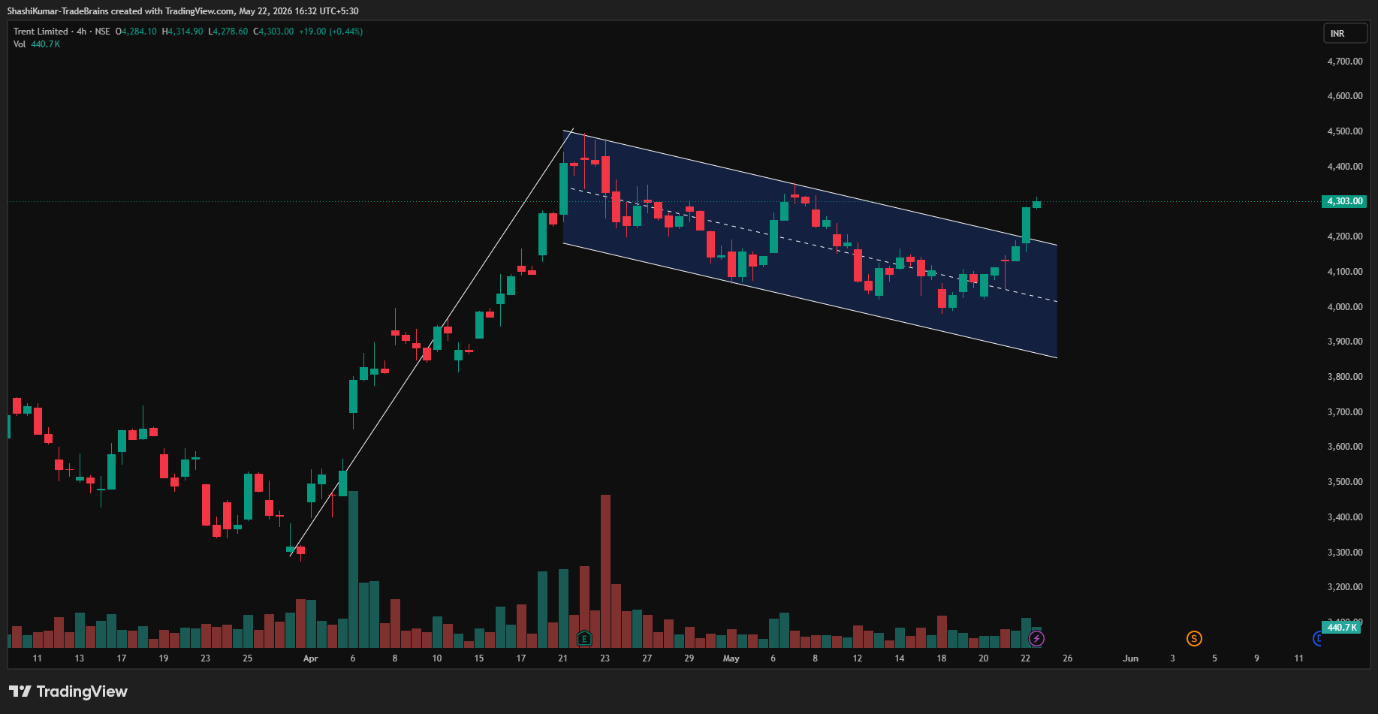
Trent Limited Chart: 4-hour Timeframe
Indicator Confirmation
- Moving Averages: On the daily time frame, the 5-day EMA was above the 9-day EMA, further confirming a bullish trend.
- RSI: The daily RSI indicates buying pressure, as it rose from 54.76 in the previous trading session to 60.88 on Friday.
- Price Volume Trend: The Price Volume Indicator confirms the uptrend, accompanied by a sharp increase in buying volume in the daily time frame.
Implications
A flag and pole pattern signals a possible upward breakout. Sustaining above the Rs 4,205 support level, along with strong trading volumes, could strengthen the bullish outlook in the near term.
About the stock
Trent Limited is a leading retail company of the Tata Group, known for its strong presence in fashion, lifestyle, and grocery retail across India. The company operates popular brands such as Westside, Zudio, Star Bazaar, and Zara India, offering affordable and trendy products to consumers. With a rapidly expanding store network and strong brand value, Trent has become one of India’s fastest-growing retail companies. Over the past month, Trent Limited Ltd has decreased by 2.97%. The stock has declined 0.18% over the past six months and declined 19.45% year-over-year. For more such technical stock ideas, clickhereto view our research page.
Disclaimer: The views and investment tips expressed by investment experts/broking houses/rating agencies on tradebrains.in are their own, and not that of the website or its management. Investing in equities poses a risk of financial losses. Investors must therefore exercise due caution while investing or trading in stocks. Trade Brains Technologies Private Limited or the author are not liable for any losses caused as a result of the decision based on this article. Please consult your investment advisor before investing.
The post Trent Ltd Forms a Flag And Pole Pattern Pattern Indicating a Near-Term Bullish Breakout appeared first on Trade Brains.
Related Articles

Stocks to Watch: Hitachi Energy, Suzlon and Other Top Stocks Announcing Q4 Results Today
Synopsis: Today, several major companies, including Hitachi Energy India, Suzlon...

Dr Lal Pathlabs Develops a Double Top Pattern Signalling a Near-Term Bearish Breakdown
Synopsis: Dr Lal PathLabs Limited has developed a Double Top pattern on its 30-m...

Stocks to Watch: Asian Paints, RVNL and 8 Other Stocks Announcing Results Next Week
Synopsis: Earnings season gathers momentum this week, with key results likely to...

Star Health Stock: Why Small Cities Are Becoming Its Biggest Opportunity?
Synopsis: India’s health insurance growth is rapidly shifting beyond metros, wit...